Climate Classification
Mean monthly values of air temperature and precipitation can describe the climate of a weather station and its nearby region quite accurately. To study climates from a global viewpoint, climatologists classify these values into distinct climate types. This classification requires developing a set of rules to use in examining monthly temperature and precipitation values. By applying the rules, a climatologist can use each station's data to determine the climate to which it belongs.
This textbook recognizes 13 distinctive climate types that are designed to be understood and explained by air-mass movements and frontal zones—that is, by the weather various regions experience throughout the year. An air mass is classified according to the general latitude of its source region, which determines the temperature of the air mass and its surface type—land or ocean—within that region, which controls the moisture content. Since the air-mass characteristics control the two most important climate variables—temperature and precipitation—we can explain climates using air masses as a guide. In addition, where differing air masses are in contact, frontal zones will form. The position of these frontal zones changes with the seasons. The seasonal movements of air masses and frontal zones therefore influence annual cycles of temperature and precipitation in certain locations as well, particularly in the mid- and high latitudes.
The rules that define the climate types in this text are based on an analysis of how the amount of moisture held in the soil varies throughout the year, which is determined by air temperature and rainfall. Our discussion here will not focus on the specific climate rules but will instead focus on showing how the classification follows quite naturally from an understanding of the processes that produce variations of temperature and precipitation around the globe.
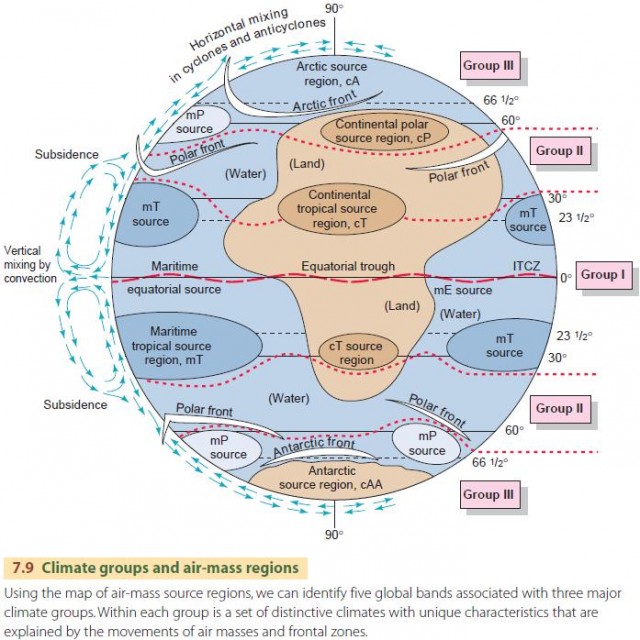
Figure 7.9 shows a schematic diagram of air-mass source regions used in conjunction with the 13 climate types described in this chapter. We have subdivided this diagram into global bands that contain three broad groups of climates: low-latitude (Group I), midlatitude (Group II), and high-latitude (Group III), described briefly as follows.
- Group I: Low-latitude climates. The region of low-latitude climates (Group I) is dominated by the source regions of continental tropical (cT), maritime tropical (mT), and maritime equatorial (mE) air masses. These source regions are related to the three most obvious atmospheric features that occur within their latitude band—the two subtropical high-pressure belts and the equatorial trough at the intertropical convergence zone (ITCZ). Air of polar origin occasionally invades regions of low-latitude climates. Easterly waves and tropical cyclones are important weather systems in this climate group as well.
- Group II: Midlatitude climates. The region of midlatitude climates (Group II) lies in the polar
front zone—a zone of intense interaction between unlike air masses. In this zone, tropical air masses moving poleward and polar air masses moving equatorward are in contact. Midlatitude cyclones are normal features of the polar front, and this zone may contain as many as a dozen midlatitude cyclones around the globe at a time. - Group III: High-latitude climates. The region of highlatitude climates (Group III) is dominated by polar and arctic (including antarctic) air masses. In the arctic belt of the 60th to 70th parallels, continental polar air masses meet arctic air masses along an arctic-front zone, creating a series of eastward-moving midlatitude cyclones. In the southern hemisphere, there are no source regions in the subantarctic belt for continental polar air—just a great single oceanic source region for maritime polar (mP) air masses. The pole-centered continent of Antarctica provides a single great source of the extremely cold, dry antarctic air mass (cAA). These two air masses interact along the antarctic-front zone.
Within each of these three climate groups are several climate types (or simply, climates)—four low-latitude climates (Group I), six midlatitude climates (Group II), and three high-latitude climates (Group III)—for a total of 13 climate types. Each climate has a name and a number. The name describes the general nature of the climate and also suggests its global location. The number helps to identify the climate on maps and diagrams. In the text, we will include both the climate name and number for convenience.
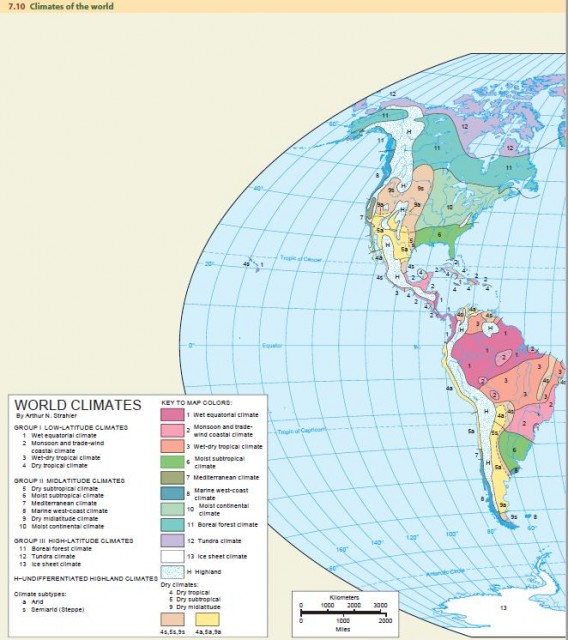
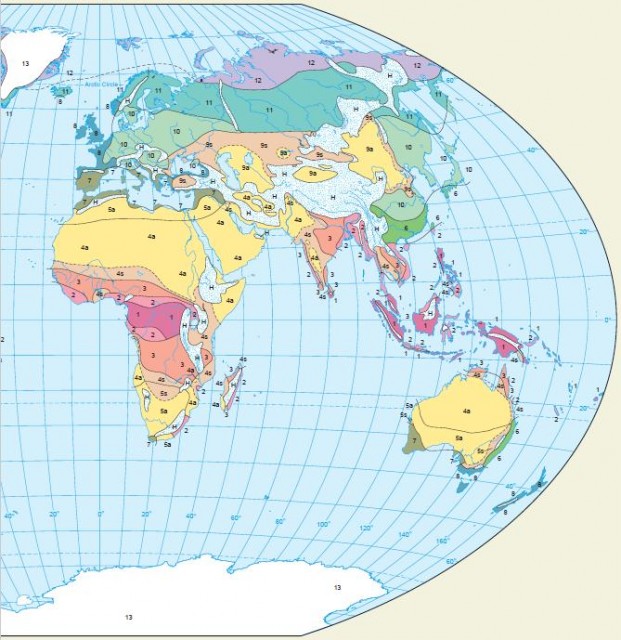
The world map of climates, Figure 7.10, shows the actual distribution of climate types on the continents.
DRY AND MOIST CLIMATES
All but 2 of the 13 climate types are classified as either dry climates or moist climates. Dry climates are those in which total annual evaporation of moisture from the soil and from plant foliage exceeds annual precipitation by a wide margin. Generally speaking, the dry climates do not support permanently flowing streams.
The soil is dry much of the year, and the land surface contains only a sparse plant cover—scattered grasses or shrubs—or simply lacks plant cover. Moist climates are those with sufficient rainfall to maintain the soil in a moist condition through much of the year and to sustain the year-round flow of the larger streams. Moist climates support forests of many types or prairies of dense, tall grasses.
Within the dry climates there is a wide range of aridity, from very dry deserts nearly devoid of plant life to moister regions that support a partial cover of grasses or shrubs. We will refer to two dry climate subtypes: (1) semiarid (or steppe) and (2) arid. The semiarid (steppe) subtype, designated by the letter s, is found next to moist climates. It has enough precipitation to support sparse grasses and shrubs. The arid subtype, indicated by the letter a, ranges from extremely dry climates to climates that are almost semiarid.
In addition, 2 of our 13 climates cannot be accurately described as either dry or moist climates. These are the wet-dry tropical 3 and Mediterranean 7 climate types. Instead, they show a seasonal alteration between a very wet season and a very dry season. This striking contrast in seasons gives a special character to the two climates, and so we have singled them out for special recognition as wet-dry climates.
HIGHLAND CLIMATES
Mountains and high plateaus have climates that are different from those of surrounding lowlands. They tend to be cool to cold because air temperatures in the atmosphere normally decrease with altitude. They are also usually moist, getting wetter at higher locations as orographic precipitation increases.
Highland areas usually derive their annual temperature cycle and the times of their wet and dry seasons from the climate of the surrounding lowland. For example, New Delhi, the capital city of India, lies in the Ganges lowland, while Simla, a mountain refuge from the hot weather, is located at about 2200 m (about 7200 ft) in the foothills of the Himalayas.
When the hot-season temperature averages over 32°C (90°F) in New Delhi, Simla is enjoying a pleasant 18°C (64°F). But note that the two temperature cycles, shown in Figure 7.12, are quite similar in shape, with January as the minimum month for both. The annual rainfall cycles are also similar in shape, but Simla receives more than double the rainfall of New Delhi.
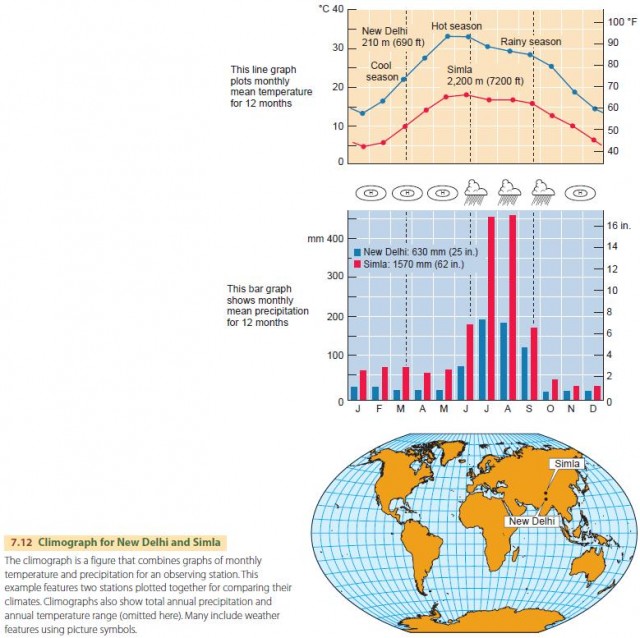
The example of the highland climate also allows us to illustrate the use of the climograph—a handy pictorial device that shows the annual cycles of monthly mean air temperature and monthly mean precipitation for a location, along with some other useful information (Figure 7.12). We will make frequent use of climographs to provide examples of the 13 climate types discussed in the remainder of this chapter.
THE KOPPEN CLIMATE SYSTEM
An alternative climate classification is that devised by the Austrian climatologist Vladimir Koppen in 1918 and modified by Geiger and Pohl in 1953. It uses a system of letters to label climates. The classification is based on mean annual values of temperature and precipitation, the season of highest precipitation (high-Sun, low-Sun), and the precipitation of the driest month. Although it is not designed to reflect the causes of climate patterns, such as air-mass motions or coastal versus continental location, it is still in use. The system is described more fully in the Special Supplement following this chapter. We also identify the Koppen classification equivalents for the classes used below.