How Do We Investigate Geographic Questions?
PHYSICAL GEOGRAPHERS STUDY DIVERSE PROBLEMS, ranging from weather systems and climate change to ocean currents and landscape evolution. The types of data required to investigate each of these problems are equally diverse, but most geographers try to approach the problem in a similar, objective way, guided by spatial information, and relying on various geographic tools. Geography utilizes approaches from the natural and social sciences, blending them together in a geographic approach. Like other scientists, geographers pose questions about natural phenomena and their implications, propose a possible explanation (hypothesis) that can be tested, make predictions from this hypothesis, and collect data needed to critically evaluate whether the hypothesis passes the tests.
How Do Geographers Approach Problems?
Geographers ask questions like the following:
- Where is it?
- Why is it where it is?
- How did it get where it is?
- Why does it matter where it is?
- How does “where it is” influence where other things are and why they are there?
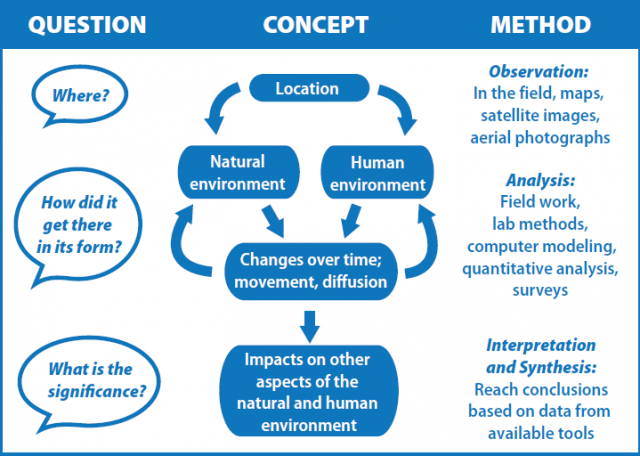
The conceptual basis of these questions lies in the notion that the location of something affects, and is a product of, other features or processes in both the natural and human environment, and of interactions between the natural and human environments. Natural and human phenomena are constantly changing and constantly impacting other features in new ways, influencing aspects like site selection and risk of natural hazards. To address such complex issues, we use a variety of tools and methods, such as maps, computer-simulation models, aerial photographs, satellite imagery, statistical methods, and historical records. The figure to the right illustrates some aspects to consider.
What Is the Difference Between Qualitative and Quantitative Data?
Geographers approach problems in many ways, asking questions about Earth processes and collecting data that help answer these questions. Some questions can be answered with qualitative data, but others require quantitative data, which are numeric and are typically visualized and analyzed using data tables, calculations, equations, and graphs.
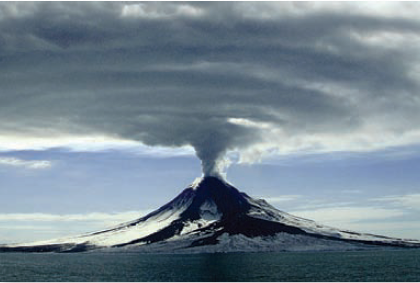
When Augustine volcano in Alaska erupts, we can make various types of observations and measurements. Some observations are qualitative, like descriptions, and others are measurements that are quantitative. Both types of data are essential for documenting natural phenomena.
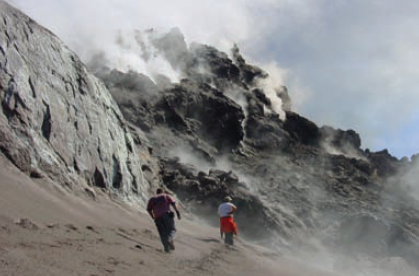
Qualitative data include descriptive words, labels, sketches, or other images. We can describe this picture of Augustine volcano with phrases like “contains large, angular fragments,” “releases steam,” or “the slopes seem steep and unstable.” Such phrases can convey important information about the site.
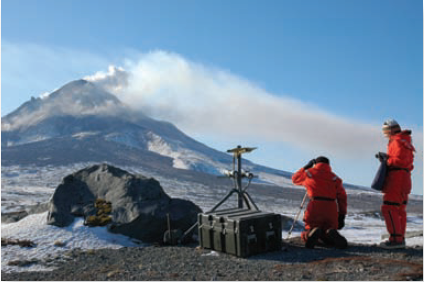
Quantitative data involve numbers that represent measurements. Most result from scientific instruments, such as this thermal camera that records temperatures on the volcano, or with measuring devices like a compass. We could also collect quantitative measurements about gases released into the air.
How Do We Test Alternative Explanations?
Science proceeds as scientists explore the unknown — making observations and then systematically investigating questions that arise from observations that are puzzling or unexpected. Often, we try to develop several possible explanations and then devise ways to test each one. The normal steps in this scientific method are illustrated below, using an investigation of groundwater contaminated by gasoline.
1. Someone makes the observation that groundwater from a local well near an old buried gasoline tank contains gasoline. The first step in any investigation is to make observations, recognize a problem, and state the problem clearly and succinctly. Stating the problem as simply as possible simplifies it into a ore
manageable form and helps focus our thinking on its most important aspects.
2. The observation leads to a question — Did the gasoline in the groundwater come from a leak in the buried tank? Questions may be about what is happening currently, what happened in the past, or, in this case, who or what caused a problem.
choose the one that, based on the data, is most likely to be correct.