Ocean Circulation
Just as there is a circulation pattern to the atmosphere, there is also a circulation pattern to the oceans that it is driven by differences in density and pressure acting along with the Coriolis force. Pressure differences are created in the water when the ocean is heated unequally, because warm water is less dense than cold water. These pressure differences induce the water to flow. Saltier water is also more dense than less salty water, so differences in salinity can also cause pressure differences. The force of wind on the surface water also creates oceanic circulation.
TEMPERATURE LAYERS OF THE OCEAN
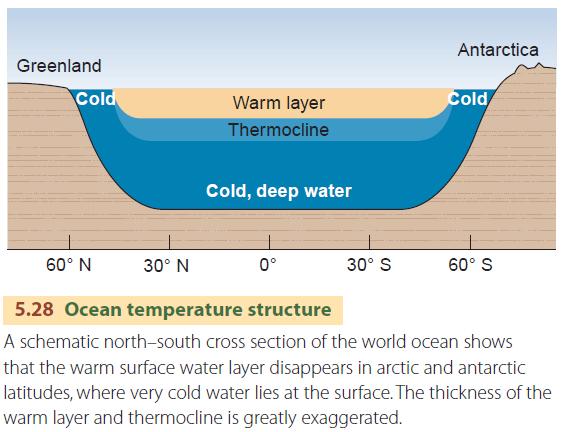
The ocean's layered temperature structure is shown in Figure 5.28. At low latitudes throughout the year and in middle latitudes in the summer, a warm surface layer develops, heated by the Sun. Wave action mixes heated surface water with the water below it to form the warm layer, which may be as thick as 500 m (about 1600 ft) with a temperature of 20° to 25°C (68° to 77°F) in oceans of the equatorial belt. Below the warm layer, temperatures drop rapidly in a zone known as the thermocline. Below the thermocline is a layer of very cold water extending to the deep ocean floor. Temperatures near the base of the deep layer range from 0°C to 5°C (32° to 41°F). This layering is quite stable because the warm layer is less dense than the cold water and rests on top. In arctic and antarctic regions, the warm layer and thermocline are absent.
SURFACE CURRENTS
An ocean current is any persistent, dominantly horizontal flow of ocean water. Current systems exchange heat between low and high latitudes and are essential in sustaining the global energy balance. Surface currents are driven by prevailing winds, while deep currents are powered by changes in temperature and density in surface waters that cause them to sink.
In surface currents, energy is transferred from the prevailing surface wind to water by the friction of the air blowing over the water surface. Because of the Coriolis effect, the actual direction of water drift is deflected about 45° from the direction of the driving wind.
The general features of the circulation of the ocean bounded by two continental masses include two large circular movements, called gyres, that are centered at latitudes of 20°–30°. These gyres track the movements of air around the subtropical high-pressure cells. An equatorial current with westward flow marks the belt of the trade winds. Although the trades blow to the southwest and northwest at an angle across the parallels of latitude, the surface water movement follows the parallels. The equatorial currents are separated by an equatorial countercurrent. A slow, eastward movement of surface water over the zone of the westerlies is named the west-wind drift. It covers a broad belt between latitudes 35° and 45° in the northern hemisphere and between latitudes 30° and 60° in the southern hemisphere. These features, as well as others, appear on our map of January ocean currents.
Because ocean currents move warm waters poleward and cold waters toward the Equator, they are important regulators of air temperatures. Warm surface currents keep winter temperatures in the British Isles from falling much below freezing in winter. Cold surface currents keep weather on the California coast cool, even in the height of summer.
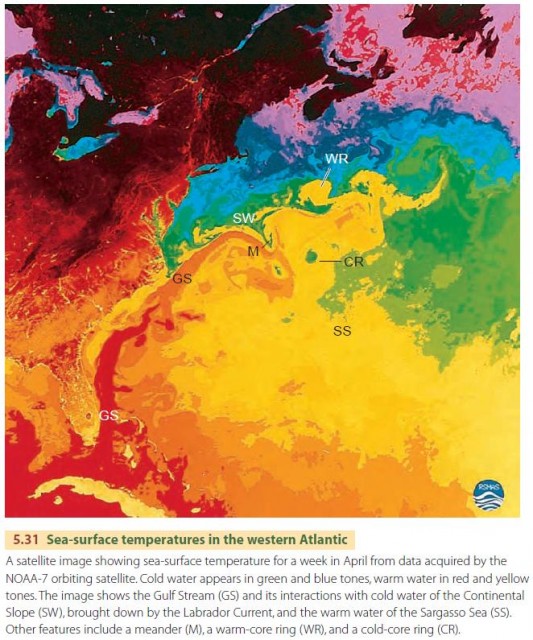
Figure 5.31 shows a satellite image of ocean temperature along the east coast of North America for a week in April. The Gulf Stream stands out as a tongue of warm water, moving northward along the southeastern coast. Cooler water from the Labrador Current moves southward along the northern Atlantic coast. Instead of mixing, the two flows remain quite distinct. The boundary between them shows a wavelike flow, much like jet stream disturbances in the atmosphere.
EL NINO AND ENSO
Another phenomenon of ocean surface currents is El Nino, described in our opening feature, Eye on Global Change—El Nino. In an El Nino year, a major change in barometric pressure occurs across the entire stretch of the equatorial zone as far west as southeastern Asia. Normally, low pressure prevails over northern Australia, the East Indies, and New Guinea, where the largest and warmest body of ocean water is located (Figure 5.32).
Abundant rainfall occurs in this area during December, which is the high-Sun period in the southern hemisphere. During an El Nino event, the low-pressure system is replaced by a weak high pressure zone and local drought ensues (Figure 5.32). Pressures drop in the equatorial zone of the eastern Pacific, strengthening the equatorial trough. Rainfall is abundant in this new low-pressure region (right part of figure). The shift in barometric pressure patterns is known as the Southern Oscillation, and the two phenomena taken together are often referred to as ENSO.
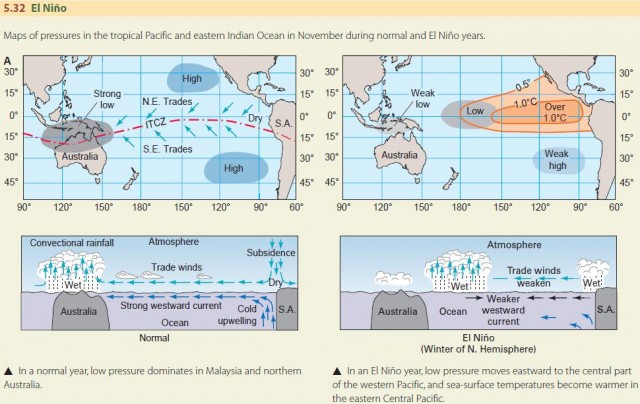
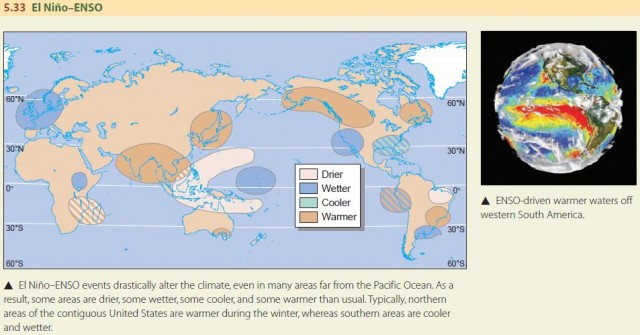
Surface winds and currents also change with this change in pressure. During normal conditions, the strong, prevailing trade winds blow westward, causing very warm ocean water to move to the western Pacific and to “pile up” near the western equatorial low. This westward motion causes the normal upwelling along the South American coast, as bottom water is carried up to replace the water dragged to the west. During an El Nino event, the easterly trade winds weaken with the change in atmospheric pressure. Without the westward pressure of the trade winds, warm waters surge eastward. Sea-surface temperatures and actual sea levels rise off the tropical western coasts of the Americas. Through teleconnections that are not completely understood, these changes in Pacific sea-surface temperature and wind fields can impact climate in faraway regions (Figure 5.33).
A related phenomenon, also capable of altering global weather patterns, is La Nina (the girl child), a condition roughly opposite to El Nino. During a La Nina period, sea-surface temperatures in the central and western Pacific Ocean fall to lower than average levels. This happens because the South Pacific subtropical high becomes very strongly developed during the high-Sun season. The result is abnormally strong easterly trade winds. The force of these winds drags a more-than-normal amount of warm surface water westward, which enhances upwelling along western continental coasts.
El Nino and La Nina occur at irregular intervals and with varying degrees of intensity. When severe, these events can have disastrous effects on weather around the world, as we noted in the Eye on Global Change section beginning this chapter. Rainfall and temperature cycles can change significantly in seemingly unrelated parts of the globe, producing floods, droughts, and temperature extremes. Notable recent El Nino events occurred in 1982–1983, 1989–1990, 1991–1992, 1994–1995, 1997–1998, and 2002–2003.
What causes the ENSO phenomenon? One view is that the cycle is a natural oscillation caused by the way in which the atmosphere and oceans are coupled through temperature and pressure changes. Each ocean–atmosphere state has positive feedback loops that tend to make that state stronger. Thus, the ocean and atmosphere tend to stay in one state or the other until something occurs to reverse the state. In any event, scientists now have good computer models that accept sea-surface temperature along with air temperature and pressure data and can predict El Nino events reasonably well some months before they occur.
El Nino and its alter ego La Nina show how dynamic our planet really is. As a grand-scale, global phenomenon, El Nino–La Nina shows how the circulation patterns of the ocean and atmosphere are linked and interact to provide teleconnections capable of producing extreme events affecting millions of people throughout the world.
PACIFIC DECADAL OSCILLATION
Another oceanic phenomenon that influences climate is marked by changes in sea-surface temperature in the northern Pacific Ocean that can produce climate changes across parts of Eurasia, Alaska, and the western United States. These changes interact with ENSOrelated changes, either strengthening or weakening them. The changes in the North Pacific pressure pattern can last from weeks to decades. The decadal changes, (Figure 5.34) are called the Pacific decadal oscillation (PDO). They can persist on a scale of 20 to 30 years. The causes of the oscillation are not well understood.
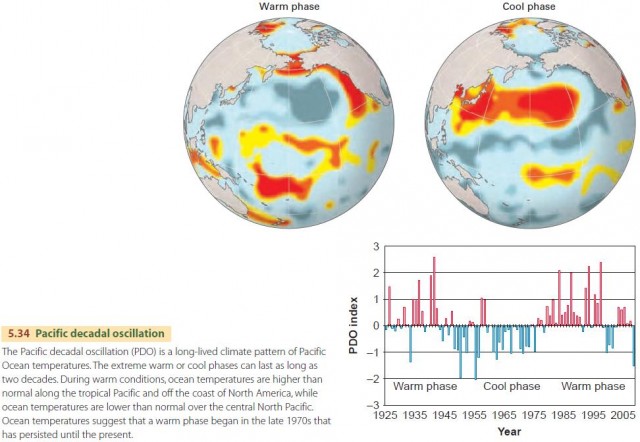
The Pacific decadal oscillation has shown two full cycles in the past century, with cool phases from 1890–1924 and 1947–1976 and warm phases from 1925–1946 and 1977 to the present. In the warm phase, eastward-moving Pacific storm systems track to the south, leaving the northwestern portion of the United States warm and dry, while the arid southwest receives more rainfall than normal. In the cool phase, the northwestern United States becomes cooler and wetter, while drought comes to California and the southwest. The phases also have strong effects on marine coastal fisheries, with the most productive regions shifted northward to Alaskan waters during the warm phase and southward in the cool phase.
NORTH ATLANTIC OSCILLATION
Another ocean–atmosphere phenomenon affecting climate is the North Atlantic oscillation (NAO), which is associated with changes in atmospheric pressures and sea-surface temperatures over the mid- and high latitudes of the Atlantic. The North Atlantic oscillation is predominantly an atmospheric phenomenon that is partly related to variations in the surface pressure gradient between the polar sea ice cap and the midlatitudes in both the Atlantic and Pacific Ocean basins. It may also be linked to changes in the ocean surface temperature and possibly snow and ice cover over Europe and Greenland.
Shifts in the North American oscillation can occur over the course of weeks, seasons, and even decades. Since about 1975, the positive phase has dominated, bringing wetter but milder conditions to northern Europe and dry conditions to southern Europe.
DEEP CURRENTS AND THERMOHALINE CIRCULATION
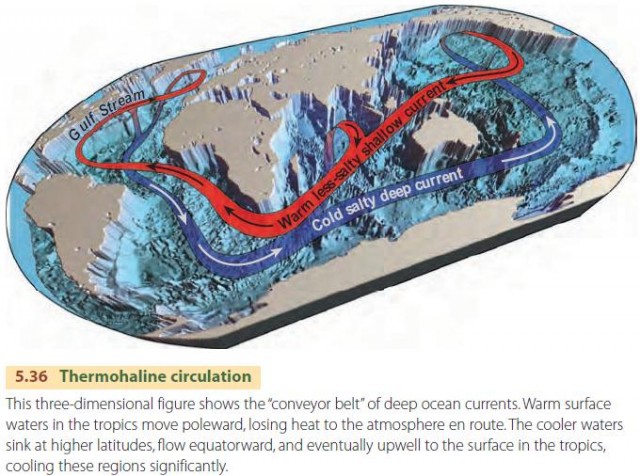
Deep currents move ocean waters in a slow circuit across the floors of the world's oceans. They are generated when surface waters become more dense and slowly sink downward. Coupled with these deep currents are very broad and slow surface currents on which the more rapid surface currents, described above, are superimposed. Figure 5.36 diagrams this slow flow pattern, which links all of the world's oceans. It is referred to as thermohaline circulation, since it depends on the sinking of cold, salty water along the northern edge of the Atlantic. The sinking leads eventually to upwelling at far distant locations, as described in the figure.
Thermohaline circulation plays an important role in the carbon cycle by moving CO2-rich surface waters into the ocean depths. As noted in Chapter 3 in Eye on the Environment 3.1. Carbon Dioxide—On the Increase, deep ocean circulation provides a conveyor belt for storage and release of CO2 in a cycle of about 1500 years' duration. This allows the ocean to moderate rapid changes in atmospheric CO2 concentration, such as those produced by human activity through fossil fuel burning.
Some scientists have observed that thermohaline circulation could be slowed or stopped by inputs of fresh water into the North Atlantic. Such freshwater inputs could come from the sudden drainage of large lakes formed by melting ice at the close of the last Ice Age. The fresh water would decrease the density of the ocean water, keeping the water from becoming dense enough to sink. Without sinking, circulation would stop. In turn, this would interrupt a major flow pathway for the transfer of heat from equatorial regions to the northern midlatitudes. This mechanism could result in relatively rapid climatic change and is one explanation for the periodic cycles of warm and cold temperatures experienced since the melting of continental ice sheets about 12,000 years ago.