Taking the weather’s pulse
According to rock legend Bob Dylan, you don't need a weatherman to know which way the wind is blowings He's got a point. Wet your finger, put it into the breeze, and you'll sense the wind's direction right away. You could do the same thing with a basic wind vane or, for that matter, with a Doppler weather radar that costs millions of US dollars.
Humans made do with the most cursory weather instruments for millennia. Rainfall was measured numerically as early as the fourth century BC in India, and Egyptians have measured the height of the life-giving Nile River for 5000 years using gauges dubbed nilometers. Exceptions like these aside, most weather was measured qualitatively: strong or light wind, cloudy or fair skies, dry or humid air. Numbers didn't enter the picture in a big way until the seventeenth century, when a set of Renaissance scientists figured out how to tease information out of the weight of the air, the heat within it, the strength of the wind, and the water vapour floating through it all. These new instruments transformed the way we see weather. Before long, people across the world were using a common scientific language to record the state of the atmosphere.
As instruments took flight aboard balloons, rockets and airplanes, we began to get our first truly 3-D grasp of the way weather worked. Yet nearly all instruments before World War II did their work in situ. Radar was the first widespread device that could sense the weather from afar and report back on it Then came the weather satellite, a Cold War spin-off that blossomed in the 1960s and 1970s. Now, digital sensors and processors have reinvented classic weather instruments. Despite all the show-stopping imagery from satellites and radar, our current global weather-observing network still hinges on the lowly in situ instruments – thermometers, barometers and the like.
Blowin in the wind Perhaps because you didn't need a weatherman to measure it, wind direction was one of the first elements of the air that came under regular scrutiny. Ancients in China, Babylon, Egypt, Greece and elsewhere developed wind vanes before the time of Christ. The most famous of these is the Tower of the Winds, built by astronomer Andonikos in the Roman agora of Athens around 50 BC. The concrete tower included a frieze with carvings of the deities associated with each of the eight wind directions (N, NE, E, SE, etc). Above this was a bronze Triton that spun on an axis, a rod in his right hand always pointing into the wind. Triton is long gone, but the 12m/40ft tower remains, along with sundials and the remnants of a water clock. England's Royal Meteorological Society uses the Tower of the Winds as its symbol.
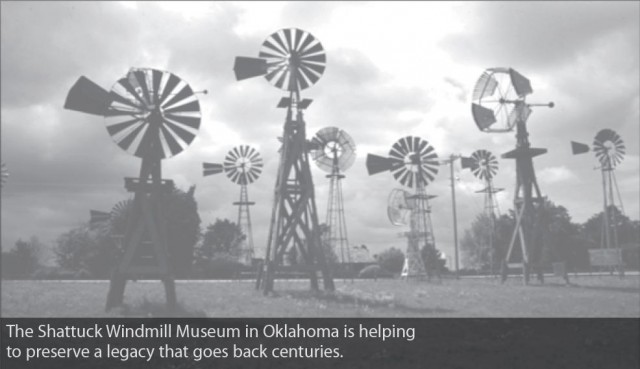
Wind vanes survived the Dark Ages and made something of a comeback in the pre-Renaissance era, when they crowned many European churches. Even without knowing the exact speed of the wind, people already saw it as a useful energy source. Over 10,000 windmills were spinning across England by 1400, long before the devices became synonymous with the Netherlands. Meanwhile, the art of weather observing was making slow progress. At Oxford, Walter Merle kept one of the earliest daily weather journals known, from 1337 to 1344. A hundred years later, German cardinal Nicholas Cusanus came up with a scheme for sensing humidity via the amount of moisture absorbed by a bundle of wool.
A burst of scientific invention spread across Europe in the seventeenth century with some of the world's most renowned minds turning their attention to the techniques of weather observing. The atmosphere – always at hand – was one of the prime subjects of study.
- Temperature Although the ancient Greek physician Galen explored the idea of degrees of hot and cold, these weren't quantified as we now know them until centuries later. Galileo experimented with the heat-induced expansion of liquid in a tube, but the sealed, liquid-in-glass thermometer was actually invented in 1660 by a member of royalty – Ferdinand II, the Grand Duke of Tuscany and one of the famed Medici clan. He and other early makers of thermometers experimented with water and wine; mercury later became the standard. The two best-known temperature scales, Celsius and Fahrenheit, were both developed in the early 1700s. By 1800, special maximum and minimum thermometers could indicate each day's high and low temperature through a small in-glass element.
- Pressure Measuring the weight of the air had to wait, ironically, until people believed in its absence. In the 1640s, most scientists didn't think a vacuum could occur in nature. Gasparo Berti proved them wrong with a bold experiment He built a glass tube several storeys high alongside his house in Rome, filled the tube with water, closed the top and opened the bottom into a water-filled pail. The water in the tube dropped to a certain point then stopped, leaving a space that Berti correctly concluded was a vacuum. Another Roman scientist, Evangelista Torricelli, built the first true barometer between 1643 and 1644 using mercury, about fourteen times denser than water. The mercury stood about 0.76m/30in in Torricelli's tube, as opposed to the water height of roughly 9m/30ft in Berti's. Today, we still refer to pressure in units of length (eg 29.92in of mercury) even though actual mercury barometers are rare. Most household barometers are now aneroid: they measure the expansion and contraction of a sensitive bellows held open by an internal spring.
- Humidity Centuries after Cusanus thought of weighing the water in wool to measure moisture in the air, people were building hygrometers using strings, boards and other stretchable devices that expanded or contracted as the air become more moist or dry.This bizarre line-up included an ox's intestine, a rat's bladder and strips of whale bone; even wild oats were hooked up to dials that recorded the twisting and untwisting of their sprouts. Human hair became the era's most popular tool for measuring humidity. A single lock of degreased human hair stretches about 2.5 percent in length as the relative humidity goes from near 0 to 100 percent. By the twentieth century, many weather observers had moved from hygrometers to sling psychrometers made of side-by-side thermometers, one kept dry and the other wrapped in muslin and dampened at measurement time. When the instrument is slung (carefully) in a circle, the muslin-coated thermometer cools to a reading known as the wet-bulb temperature. Standard tables then relate the wet-bulb reading to relative humidity.
- Wlndspeed The first anemometer, built around 1450 by Leon Battista Alberti, featured a tiny board hanging from a wind vane. As the wind speed increased, the board swung upward with its tip following a curved scale. Much fancier versions, using plates, spheres and other objects, were created into the eighteenth century, and similar designs are found today in schoolchildren's weather kits. Britain's Follett Osier created the first practical recording anemometer by measuring the pressure on a plate that turned to face the wind. Osier cleverly combined this with a rain gauge so that a movable pen traced the readings from both. One of the most common mechanical designs, a cup anemometer, uses a set of three angled cups that catch the wind as they rotate around a spindle; the wind speed is inferred from the rotation rate.
- Cloud cover and visibility Traditionally, human observers have classified clouds by their height and appearance. With the advent of aviation, clouds and visibility began to take on a new importance. Nephoscopes measure the speed and direction of cloud motion, while ceilometers use beams of light reflected off clouds to calculate ceiling height. Satellites are another key source of cloud cover data. Visibility at ground level can be judged by whether certain objects at a known distance, such as buildings or mountains, are obscured or not Along with these core instruments, a wealth of others have evolved, measuring such things as the duration of sunshine. By the early twentieth century, technology allowed the continuous recording of many weather variables.
Microprocessors now allow almost every type of atmospheric quality to be measured digitally with incredible precision. Some high-tech instruments can deduce temperature, moisture, wind and other variables by examining how the character of an electromagnetic wave (wavelength, speed, etc) changes as it travels through air across a short distance from transmitter to receiver.
Up, up and away These days it's a tranquil pastime of the middle classes, but hot-air ballooning was once a heated scientific endeavour. The French brothers Joseph-Michel and Jacques-Elienne Montgolfier pioneered this particular mode of travel in 1783 and not long afterwards researchers around the world were taking barometers and thermometers with them on air journeys. An English mathematician and his co-pilot suffered frostbite and asphyxia in 1865 while observing the weather from a balloon nearly 10km/6 miles high. By the 1920s, automated instruments were climbing by kite, balloon and aircraft and recording whatever they found. However, many readings were lost as instruments crashed to the ground far from their launch sites.
Radio saved the day in the 1930s by allowing weather data to be transmitted as it was collected.
Within a few years, countries around the world were launching hundreds of the small instrument-and-balloon packages known as radiosondes each day. Using compact sensors that have grown ever smaller and more sophisticated with time, radiosondes send back temperature, pressure and humidity data. Wind speed and direction were traditionally inferred by tracking the path of the radiosonde; now, the motion is calculated using Global Positioning System (GPS) sensors. The data gathered daily from hundreds of radiosonde journeys continues to serve as the framework of our global weather picture, supplemented by other observations and by computer models.
What about beaming a picture of Earth itself from space? In his 1865 book From the Earth to the Moon, futurist/novelist Jules Verne wrote of lunarnauts viewing “rings of clouds placed concentrically round the terrestrial globe”. Fellow dreamer and novelist Arthur С Clarke, in the 1940s, was among the first to imagine satellites stationed in space. Some of the first cloud photos from space were taken from 1946 to 1952 by Nazi-manufactured A-4 rockets that had been confiscated by the US. Still, the meteorological Holy Grail remained a device that could take image after image without plummeting to Earth.
The launch of the Soviet Unions Sputnik satellite in 1957 goosed the US into stepping up its own satellite development. In April 1960, an experimental US weather satellite went into orbit Five years later, a successor had delivered enough images to assemble the first mosaic portrait of the entire planet, and in 1966 routine coverage began. Today, roughly a dozen weather satellites from the US, China, Japan, India, Russia and a European consortium keep a continuous watch on Earth, and another dozen or so experimental weather satellites are also in the sky. Most satellites are either geosynchronous (rotating with the planet above a fixed point at heights of about 36,200km/22,500 miles) or polar-orbiting (circling the planet from pole to pole about every 100 minutes at altitudes near 800km/500 miles).
Typically, satellites can detect energy from more than one wavelength, which expands their range of products far beyond a simple photograph.
- Visible imagery provides the crisp black-and-white satellite photos often shown on the evening weathercast and on weather websites. These devices rely on sunlight reflected from clouds and Earth.
- Infrared sensors detect the heat, rather than visible light rising from clouds and from water vapour. Since they don't rely on sunlight they can furnish photos 24 hours a day. The infrared photos on TV weathercasts are often colour-enhanced, with the colours denoting cloud temperature.The most vivid hues are normally keyed to the highest (and thus coldest) cloud tops near the centres of thunderstorms, hurricanes and other big weather systems.
Another revolutionary weather sensor from the twentieth century was radar, developed in the 1930s and refined in World War II as a technique for tracking aircraft. The word is an acronym for radio detection and ranging, which is exactly what radar does. Microwaves travel outward from a rotating transmitter at the speed of light in brief pulses, about a thousand each second. Each pulse is intense – carrying about a megawatt of energy – but lasts only around a millionth of a second. Thus, when averaged over time, a typical weather radar emits about 1000 watts of energy, roughly the same as a microwave oven.
A tiny fraction of each radar pulse bounces back from objects it encounters along the way. The time that elapses from departure to return indicates how far away the object is, and the strength of the returning signal is a clue to the objects size and/or density (large, dense objects usually reflect a bigger fraction of the energy that hits them). By converting these signals into displays, one can locate objects and track their motion. Weather was an irritant to wartime radar operators: the blobs of energy that came back from rain and snow hindered their ability to watch for aircraft. After the war, however, it became obvious that this wartime bane was a peacetime boon.
Since the 1980s, Doppler radar has come into vogue among weather watchers working for government and in the television industry, especially in the United States. A Doppler radar does everything its older counterpart can do and more. It measures the frequency of a returning signal as well as its strength and timing. Just as your ear can sense if an ambulance is approaching or leaving by the change in pitch of its siren, a Doppler radar monitors the difference in frequency between the signals it transmits and receives, in order to tell which direction rain, snow and other particles in the air are moving. It can spot potential tornadoes by looking for a 180° change in the direction of strong winds across a distance of less than 3.2km/2 miles, often coinciding with a hook-shaped region on one side of the storm. Not every signal means a twister is on the ground, but the Doppler network installed across the US in the 1990s has more than doubled the warning lead time, which now averages over ten minutes. Portable Doppler radars also came onto the scene in the 1990s, allowing scientists to profile some of the worlds wildest weather up close.
Radar is the most famous member of a whole family of sensors, each of which send out pulses of energy and analyses the returns. Profilers are upward-pointing radars that track the winds well above ground level. Lidars are radar-like devices that use laser beams rather than microwave energy; this enables them to watch the small-scale motions of tiny air particles.
Solid observations are crucial not only to daily weather forecasting but also to tracking climate change. Global standards and long-term station records help ensure that the data show actual trends rather than variations in measurement technique. The biggest gap in measurements continues to be across the oceans, which cover almost three-quarters of the globe. Ships often take measurements along their paths, and fixed buoys can be the closest thing to a land-based weather station. Still, the observational net remains thin over the oceans. A new technique that may help fill in the oceanic gaps involves measuring a tiny atmosphere-induced delay in GPS signals to infer the state of the atmosphere across large distances.