Where does the wind go?
Wind is the flywheel of the Sun's heat engine, the motion produced by raw solar energy as it reaches Earth. It sculpts our weather, as it forms clouds, fronts and countless other weather features out of thin air. Yet for a surprisingly long time, people didn't quite know what to make of the wind. Classical and medieval scientists wrestled with the concept of wind as something distinct from the air itself. As the make-up of the atmosphere became clearer, physicists began to plot and explain the wind's typical course over Earth. It wasn't until the twentieth century that such wind-driven features as cold and warm fronts were conceptualized. Were still learning a great deal about wind. The strangely erratic streaks of damage produced within hurricanes and tornadoes, for instance, are only now being unravelled with high-resolution radar and fine-scale analysis.
Our windblown planet
Every spot on Earth has its characteristic pattern of breezes, gusts, gales and calm spells. Why does the wind favour certain directions? In ancient Greece, the winds were given names connected to deities – northerlies were Boreas, southerlies were Notos, and so forth. (Remember that when meteorologists say “northerlies”, they mean winds blowing/row the north.) Aristotle believed there were more varieties of northerly than of southerly wind. He attributed this to rain and snow that fell at higher latitudes, stimulating bursts of wind that emerged from Earth and blew toward the equator. Wacky as this might seem, it was the most widely accepted explanation for winds until Edmund Hailey – he of the famous comet – came along. In the 1680s, the British astronomer took a close look at records of wind direction from around the globe (at least as far as European explorers had ventured) and connected these reports to early readings from the newly-invented barometer.
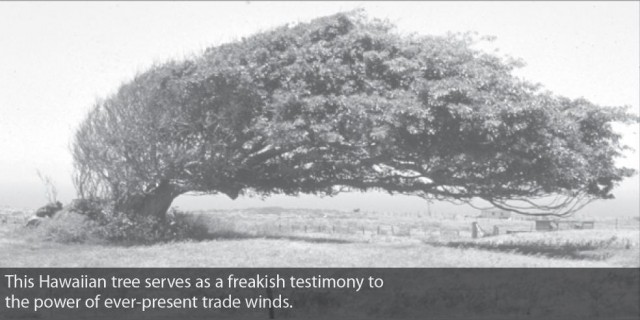
Hailey discovered a key part of our global circulation: warm air rises near the equator, flows out toward the poles at high levels, and is replaced below by a steady stream of surface winds flowing toward the equator. These are called the trade winds, possibly an allusion to their usefulness in carrying out trade via ship. (To “blow trade” once meant to follow a regular course.) Trades blow from the northeast in the Northern Hemisphere and from the southeast in the Southern Hemisphere, converging on the equator.
Hailey thought the trade winds had this east-to-west component because they followed the noonday Sun as it traversed the globe. In fact, the easterly component of the trades, and the westerly component of the prevailing winds at mid-latitudes, are both due to the Coriolis force – a byproduct of our rotating planet. Imagine a bundle of air at the North Pole that starts flowing southwards. The closer it gets to the equator, the faster Earth spins beneath it. Without the wind itself taking a turn, the southward path is soon angling toward the west, and thus this north wind has become a northeast wind. A mirror-image effect happens in the Southern Hemisphere, so trades here blow from the southeast.
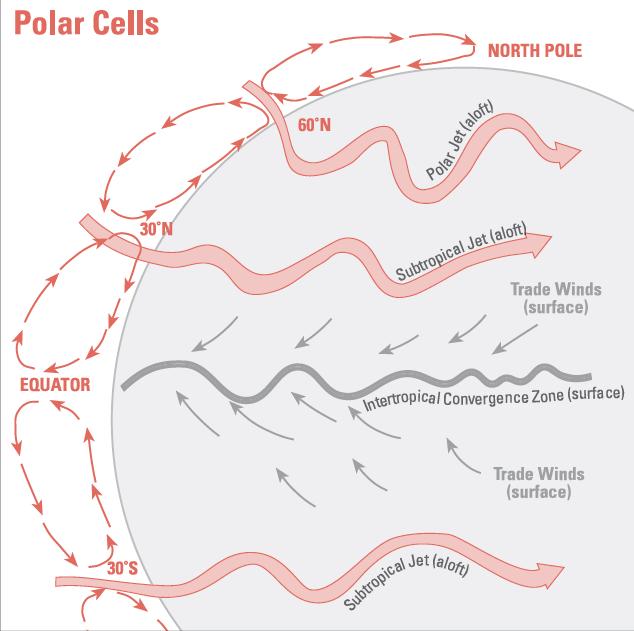
Since the trade winds only extend to the sub-tropics, Hailey's simple model needed more detail. In 1735 George Hadley added a second loop, this one in the mid-latitudes. He correctly figured out that the air flowing up and out at high altitudes from the tropics would eventually subside – as it does around 30°N and S – and some of it would flow poleward as it descended, with a component from west to east. These are called the prevailing westerlies, and they are the prime weather makers across much of Europe, Asia and North America, as well as South Africa and parts of South America The zones of subsiding air near 30°N and S have brought misery to many across the planet. Sinking air tends to dry out and warm up, and some of the world's bleakest deserts (the US Mojave, Africa's Sahara, the Great Indian Desert and Australia's Nullabor) are clustered near these latitudes. Sailors feared the listless winds of the 30° belts. As legend has it, these were dubbed the “horse latitudes” because large ships had to toss horses and other heavy cargo overboard to avoid being becalmed.
The last major leg of global circulation was discovered by American scientist William Ferrel, who in 1856 came up with a three-cell model of hemispheric winds. Ferrel balanced the subsident zones at 30°N and S with belts of rising air at 60°N and S and subsidence at the poles. The result is a set of side-by-side circuits that pull air upward, carry it north or south, and deposit it at another latitude. On average, the surface winds blow with either an eastward or westward angle based on the Coriolis force. While it's been tweaked a little since 1856, Ferrel's theory of global circulation still gets the important details right
A frontal assault
Any portrait of average global wind will fail to capture the nuances of even one day's weather. It would be unthinkable for the wind to blow from the southwest at every point across the US, Europe and northern Asia, as it does in the ultra-simplified Ferrel model. Real winds surge, fade and clash across a crazy quilt of directions and strengths.
Meteorologists knew this a century ago, but they didn't have a solid theory to explain it. Weather maps showed centres of high and low pressure circled by isobars – lines showing equal pressure. Wind arrows spun around these highs and lows on the map. Yet nowhere did the arrows collide to form what we now think of as a front. The concept simply wasn't part of the weather vocabulary of 1900. Instead, forecasters relied on a byzantine set of guide-lines to explain and predict local weather. These rules of thumb left the door open for colossal blunders.
All this changed with the advent of frontal theory, an intellectual battering ram forged in the cool northern air of Bergen, Norway. At the so-called Bergen School, Vilhelm Bjerknes assembled a feisty group of scientists – including his son, Jacob – who turned the world of weather forecasting upside down in the 1920s. By thinking of Earth's atmosphere as a fluid, they took the notion of discontinuity (think of the line separating oil and vinegar in a jar of salad dressing) and applied it to weather. They named these sharp boundaries of pressure and temperature “fronts”, and labelled them as warm or cold, based on whichever air mass was advancing.
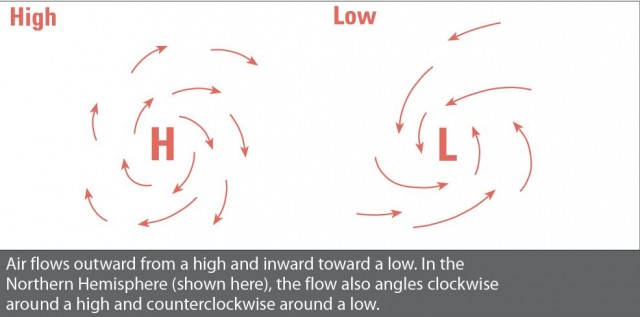
To understand fronts, it's helpful to first look at highs and lows. An “H” on a surface weather map denotes a centre of high pressure at ground level. Basically, there is more air sitting on top of this imaginary H than there is around it, so the high resembles a mound of air, with winds cascading downward and outward from it An “L”, or low-pressure centre, is the opposite beast. There's more air around the low than at its centre, so winds feed into the low and ascend through it Thanks to the Coriolis force, winds spin clockwise as they depart a high and counter-clock-wise as they approach a low in the Northern Hemisphere (the reverse is true south of the equator). The highs and lows that frequent the mid-latitudes form and decay with the help of weather features aloft.
Fronts are bands of lowered pressure that arc outward from low-pressure centres. Each front serves as a dividing line between highs of different atmospheric qualities. For example, highs often form over regions where the land (or sea) are fairly uniform, so this gives the air within each one a fairly consistent texture. If a high from the Arctic strikes in January, you can expect cold weather. The Bermuda high in summer helps deliver hot, humid conditions to eastern North America. While air masses do modify as they move over a different part of the globe whence they formed – Arctic air gradually loses its bite as it moves over warm land – they generally retain enough identity so that most frontal passages produce a distinct change in the weather. Incidentally, fronts don't have to stretch across a continent; even a sea breeze is a micro-scale front.
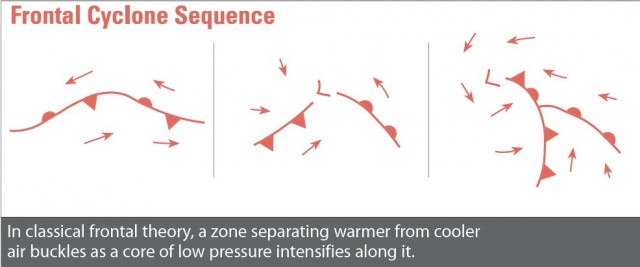
The thread that runs through the jumble of highs, lows and fronts in the Bergen School scheme is the polar front. This is the semi-permanent boundary between the temperate air of mid-latitudes and colder air closer to the poles. Bjerknes and his group linked the rising band of air in the Ferrel model to a polar front at the surface. Although the polar front straddles the globe at an average latitude of about 50 to 60°N, it sinks toward the equator in winter and retreats toward the poles in summer. On top of this seasonal shift is a whole series of northward and southward thrusts that represent the individual cold and warm fronts we re used to seeing on the weather map.
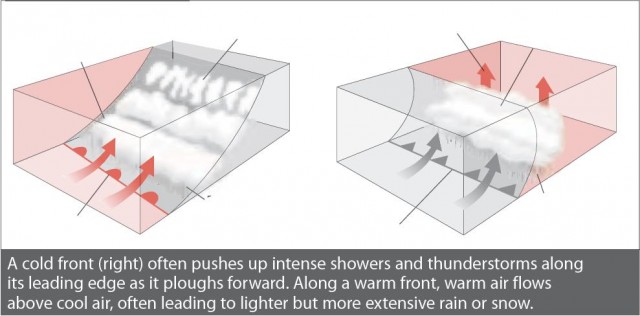
Weather at attitude
Fronts aren't merely lines on the ground. Cold air tends to sink, so a cold front slides forward like a mass of syrup flowing over a waffle, sloping backward with height. The uplift of an approaching front often helps to trigger intense but relatively brief showers and thunderstorms. A warm front, on the other hand, is tilted forward, with the cold air retreating and the warm air overspreading it. This typically produces a longer period of cloudiness with the possibility of steady rain or snow. Not all parts of the world get regular cold and warm fronts in line with the Bergen model. Classical warm fronts do not exist in Australia, for instance. Cool fronts often sweep in from the Southern Ocean, but the continental air that succeeds them is so dry that clouds and rain seldom form during the warm-up.
The Bergen School came up with an influential multi-step sequence for the evolution of a low along a front. But what makes a low or high form in the first place? As observations of the upper air became more frequent, starting in the 1930s, it became clear that the upper atmosphere held the key.
Roughly 5.5km/3.4 miles above sea level lies the mid-point of the atmosphere – the 500-millibar (or 500-hectopascal) pressure level. About half of the atmospheres mass sits above this level and half below. Warm air in the lower levels tends to push this surface upward, while cold air depresses it On a 500-millibar (500mb) map, therefore, “highs” and “lows” signify heights rather than pressure values; they represent how far up you'd need to go to reach the SOOmb pressure surface above a certain point.
Although TV weather people usually refer to the jet stream in the singular, there is more than one of them. The best-known is the band of enhanced upper-level winds called the polar jet. Typically some 350-500km/200-300 miles wide and about 5-10km/3-6 miles above sea level, it circles the globe from west to east through the mid-latitudes of the Northern Hemisphere.
Another polar jet runs from west to east in the Southern Hemisphere. Each of these rivers of air can separate into branches that rejoin hundreds of miles downstream. Within the polar jet are small pockets of intensified wind called jet streaks that can blow at speeds of 320kph/200mph or more. Meanwhile, two sub-tropical jets separate tropical from mid-latitude air as they flow around the globe close to 30° N and S – again from west to east. More-localized low-level jets can funnel air northward or southward over a few hundred miles. These usually develop in the vicinity of intense storm systems and last for a day or two, although some – like the Somali jet that swings from east Africa to India, feeding the summer monsoon – can persist for months. Situated only a mile or so above ground, low-level jets can blow at speeds topping 130kph/80mph.
Highs and lows on the ground are usually pushed anywhere from 160-800km/100-500 miles ahead of their upper-level counterparts. In the Northern Hemisphere, a southward dip (a trough of low pressure) in the jet stream induces upward motion on its east side. This helps to generate a surface low along the nearest front As the trough moves east, it urges the low along. The low may intensify if the right conditions are present, such as a strong contrast between air masses below, or upper-level winds that diverge markedly.
Some surface lows don't rely on upper-level support. “Heat lows” form in the summer desert due to the rising of sun-heated air each day. Heat lows don't cause much weather in themselves, although they can help strengthen a monsoon-type pattern by pulling in moist air from afar. Tropical cyclones, including hurricanes, rely on upper winds to be relatively weak in order to build the chimney-like circulation that allows them to grow.