Global Warming and the Greenhouse Effect
The Earth is getting warmer. In February 2007, the Intergovernmental Panel on Climate Change (IPCC), a United Nations-sponsored group of more than 2000 scientists, issued a report saying that global warming is “unequivocal”.
Is this recent warming an effect of human activity? In 1995 the IPCC concluded that human activity has probably caused climatic warming by increasing the concentration of greenhouse gases in the atmosphere. This judgment, which was upgraded to “likely” in 2001 and “very likely” in 2007, was based largely on computer simulations that showed that the release of CO2, CH4, and other gases from fossil fuel burning and human activity over the last century has accounted for the pattern of warming we have seen.
FACTORS INFLUENCING CLIMATIC WARMING AND COOLING
Carbon dioxide (CO2) is a major cause of concern because of its role in the greenhouse effect. Burning fossil fuels releases large amounts of the CO2 into the atmosphere. As human energy consumption increases, so does atmospheric CO2. Other gases that are normally present in much smaller concentrations—methane (CH4), the chlorofluorocarbons, tropospheric ozone (O3), and nitrous oxide (N2O)—are also of concern. Taken together with CO2, they are known as greenhouse gases. Figure 3.26 shows how a number of important factors have influenced global warming since about 1850.
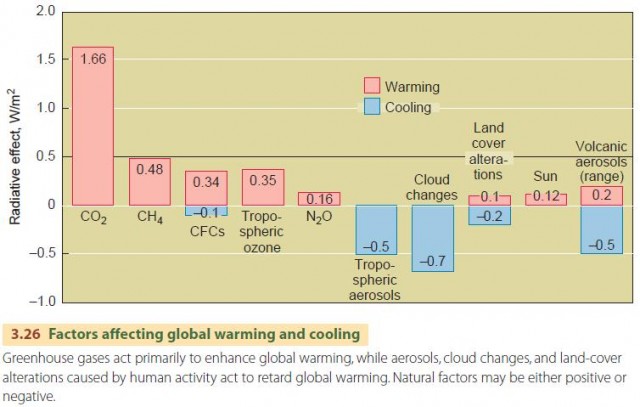
Taken together, the total enhanced energy flow to the surface produced by added greenhouse gases is about 3 W/m2. That is about 1.25 percent of the solar energy absorbed by the Earth and atmosphere. Methane, CH4, is naturally released from wetlands when organic matter decays. But human activity generates about double that amount in rice cultivation, farm animal wastes, bacterial decay in sewage and landfills, fossil fuel extraction and transportation, and biomass burning.
Chlorofluorocarbons (CFCs) have both a warming and cooling effect. The compounds are very good absorbers of longwave energy, providing a warming effect. But CFCs also destroy ozone in the stratosphere, and since ozone contributes to warming, the CFCs also have a cooling effect.
Air pollution also increases the amount of ozone in the troposphere, leading to further warming. Nitrous oxide, N2O, is released by bacteria acting on nitrogen fertilizers in soils and runoff water. Motor vehicles also emit significant amounts of N2O.
Human activity is also mostly responsible for the next three factors listed in Figure 3.26, which all tend to cool the Earth–atmosphere system. Fossil fuel burning produces tropospheric aerosols. They are a potent form of air pollution including sulfate particles, fine soot, and organic compounds. Aerosols scatter solar radiation back to space, reducing the flow of solar energy to the surface. They also enhance the formation of low, bright clouds that reflect solar radiation back to space. These, and other changes in cloud cover caused directly or indirectly by human activity, lead to a significant cooling effect. As we convert forests to croplands and pastures, which are brighter and reflect more solar energy, we induce further cooling.
The last two factors in Figure 3.26 are natural. Solar output has increased slightly, causing warming. You can see that volcanic aerosols have both a warming and, at other times, a cooling effect.
THE TEMPERATURE RECORD
When we add all these factors together, the warming effects of the greenhouse gases outweigh the cooling effects. The result is a net warming effect of about 1.6 W/m2, which is about two thirds of 1 percent of the total solar energy flow absorbed by the Earth and atmosphere. Has this made global temperatures rise? If not, will it warm the Earth in the near future? To understand the implications for the future, we must first look back at the Earth's surface temperature over the last few centuries.
The Earth's mean annual surface temperature from 1866 to 2006 is shown in Figure 3.27. We can see that temperature has increased, especially in the last 50 years. But there have also been wide swings in the mean annual surface temperature. Some of this variation is caused by volcanic eruptions. As we noted above, volcanic activity propels particles and gases—especially sulfur dioxide, SO2—into the stratosphere, forming stratospheric aerosols. Strong winds spread the aerosols quickly throughout the entire layer, where they reflect incoming solar radiation, having a cooling effect.
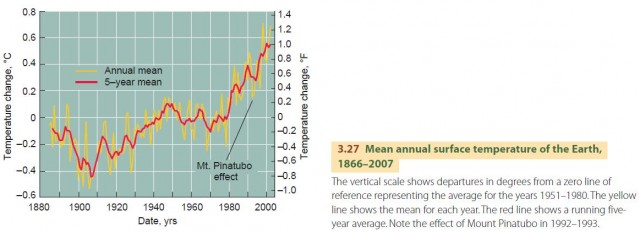
The eruption of Mount Pinatubo in the Philippines lofted 15 to 20 million tons of sulfuric acid aerosols into the stratosphere in the spring of 1991. The aerosol layer produced by the eruption reduced solar radiation reaching the Earth's surface between 2 and 3 percent for the year or so following the blast. In response, global temperatures fell about 0.3°C (0.5°F) in 1992 and 1993, which we can see caused a dip in the temperature record in Figure 3.27.
TEMPERATURE RECONSTRUCTION
We have direct records of air temperature measurements dating to the middle of the nineteenth century. If we want to know about temperatures at earlier times, we need to use indirect methods, such as tree-ring, coral, and ice core analysis.
In climates with distinct seasons, trees grow annual rings. For trees along the timberline in North America, the ring width is related to temperature—the trees grow better when temperatures are warmer. Since only one ring is formed each year, we can work out the date of each ring by counting backward from the present. Because these trees live a long time, we can extend the temperature record back several centuries.
Corals, which survive for hundreds of years, are another living record of past temperatures. As they grow, coral skeletons take up trace elements and atomic isotopes that depend on the temperature of the water. Ice cores from glaciers and polar regions show annual layers that are related to the precipitation cycles over the years. The crystalline structure of the ice, the concentrations of salts and acids, dust and pollen trapped in the layers, and amounts of trapped gases such as carbon dioxide and methane, all reveal information about longterm climate change.
All direct and indirect methods of recording temperatures show a striking upward turn in temperature over the last century, which nearly all scientists attribute to human activity.
FUTURE SCENARIOS
The year 2005 was the warmest year on record since the middle of the nineteenth century, according to data compiled by NASA scientists at New York's Goddard Institute for Space Studies. It was also the warmest year of the past thousand, according to reconstructions of past temperatures using tree rings and glacial ice cores by University of Massachusetts scientists. In fact, 2005, 2007, 1998, 2002, and 2003, ranked in order as the five warmest years since 1400. In the past 30 years, the Earth has warmed by 0.6°C (1.1°F). In the last century, it has warmed by 0.8°C (1.4°F).
What will be the future effect of this greenhouse warming? Using computer climate models, the scientists of the IPCC projected that global temperatures will warm between 1.8°C (3.2°F) and 4.0°C (7.2°F) by the year 2100.
That may not sound like very much, but the problem is that many other changes may accompany a rise in temperature. One of these changes is a rise in sea level, as glaciers and sea ice melt in response to the warming. Current predictions call for a rise of 28 to 43 cm (11.0 to 16.9 in.) in sea level by the year 2100. This would place as many as 92 million people within the risk of annual flooding.
Climate change could also promote the spread of insect-borne diseases such as malaria. Climate boundaries may shift their positions, making some regions wetter and others drier. A shift in agricultural patterns could displace large human populations as well as natural ecosystems.
Our climate could also become more variable. Very high 24-hour precipitation—extreme snowstorms, rainstorms, sleet and ice storms—have become more frequent since 1980. These more frequent and more intense spells of hot and cold weather may be related to climatic warming.
The world has become widely aware of these problems, and at the Rio de Janeiro Earth Summit in 1992, nearly 150 nations signed a treaty limiting emissions of greenhouse gases. Many details were ironed out at a subsequent meeting in Kyoto, Japan, in 1997. The Kyoto protocol called on 38 industrial nations to reduce their greenhouse gas emissions in 2008–2012 to about 8 percent below 1990 levels. By 2004, the European Union group of 23 nations had reduced their emissions by 5 percent, while the United States increased its emissions by 16 percent. China and India increased their emissions by about 50 percent, while emissions from Russia dropped by 32 percent. A recent United Nations report indicates that the 36 nations signing the Kyoto protocol, when taken together, will most likely have reduced their emissions by 5 percent between 1990 and 2012, largely as a result of the economic decline of Eastern European countries in the 1990s.
In the meantime, negotiations have begun to provide a successor to the Kyoto protocol. In 2007, a group of major CO2-emitting nations, including the United States, agreed to develop a cap-and-trade system for CO2 emissions that would apply to both industrialized nations and developing countries. If adopted, such a system could make a major contribution to reducing the rate of growth of carbon dioxide emissions in the future. While this system would not reduce atmospheric CO2 concentrations to preindustrial levels, it could lessen the impact of increasing greenhouse gases on global climate change. But it seems clear that the ultimate solution to reducing greenhouse gas concentrations and global climate change will inevitably involve harnessing solar, wind, geothermal, and even nuclear energy sources, which produce power without releasing CO2. Energy conservation and development of new methods of utilizing fossil fuels that produce reduced CO2 emissions will also be important.[CU2]
- World Patterns of Air Temperature
- Daily and Annual Cycles of Air Temperature
- Temperature Structure of the Atmosphere
- Surface and Air Temperature
- Carbon Dioxide — On the Increase
- CERES—Clouds and the Earth’s Radiant Energy System
- Net Radiation, Latitude, and the Energy Balance
- The Global Energy System
- Sensible Heat and Latent Heat Transfer