How Do Variations in Insolation Cause Global Patterns of Air Pressure and Circulation?
SEASONAL AND LATITUDINAL VARIATIONS IN INSOLATION cause regional differences in air pressure, which in turn set up regional and global systems of air circulation. These circulation patterns account for many of the characteristics of a region's climate (hot, cold, wet, dry), prevailing wind directions, and typical weather during different times of the year. Here, we focus on vertical motions in the atmosphere resulting from global variations in insolation and air pressure.
What Pressure Variations and Air Motions Result from Differences in Insolation?
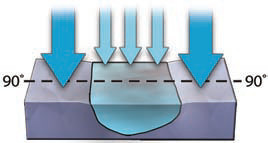
1. On this figure, the top graph plots the average amount of insolation striking the top of the atmosphere as a function of latitude. On the surface below, the large letters represent high- and low-pressure zones. Arrows show vertical and horizontal airflow and are color coded to convey the overall temperature of air.
2. The maximum amount of insolation striking the Earth is along the equator up the air, causing the warm air to expand and rise. The expansion and rising results in a zone of surface low pressure in equatorial regions. The upward flow of air helps increase the height of the tropopause over the equator, as shown by the dashed line.
3. Surface winds flow toward the low pressure to replace the rising tropical air. The rising tropical air cannot continue past the tropopause, so as it reaches these heights it flows away from the equator (EQ) to make room for more air rising from below. This upper-level air descends in the subtropics, near 30° latitude, where it forms a zone of high pressure.
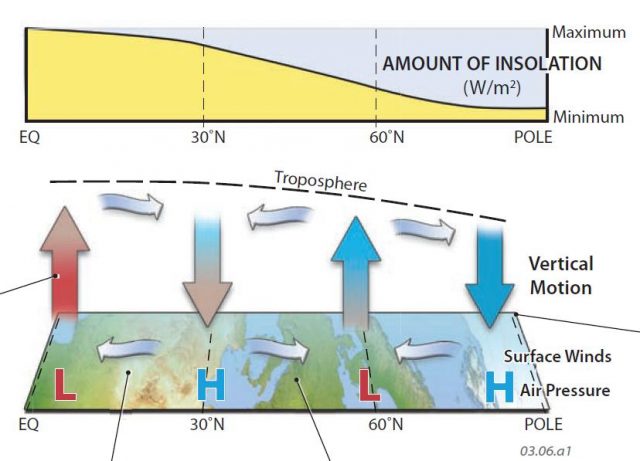
4. The amount of insolation decreases away from the equator, with a relatively sharp drop-off across the mid-latitudes (30° to 60° latitude). Descending air and high pressure in the subtropics causes surface air to flow toward higher latitudes (to the right in this diagram).
5. The amount of insolation reaches a minimum near the poles. Air near the poles is very cold and dense, sinking to form a zone of high pressure near the surface. The descending air flows away from the pole, toward 60° latitude. In the upper atmosphere, air flows toward the poles to replenish the air that sank.
6. This global pattern of rising and sinking air and resulting low and high air pressures dominates the motion of Earth's atmosphere. The pattern results from variations in insolation and is compensated by horizontal flows, both near the surface and in the upper atmosphere.
Differences in Responses of Land and Oceans at Different Latitudes
The figures below correspond to the same four regions described above, but focus on differences in behavior between land and water.
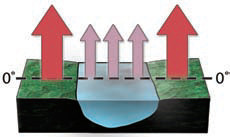
7. In equatorial regions, which have an energy excess, the rising warm air produces low air pressure. The land warms faster than the sea, so the air is even warmer over the landmasses and the air pressure is correspondingly lower. Rising warm air and low air pressure also prevail over the equatorial oceans, although temperatures tend to be cooler and pressures are not quite so low.
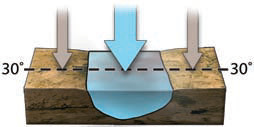
8. In the subtropics, at approximately 30°, cool air descends from the upper troposphere and causes higher-than-normal air pressures. In the subtropics, oceans are usually cooler than the surrounding continents. Air descending over the oceans will warm up less than air descending over the warmer continents, and so air pressures are particularly high over the oceans.
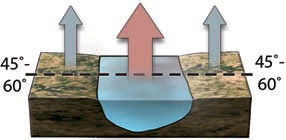
9. Air in the mid-latitudes is forced to ascend by surface air converging from the poles and subtropics. This zone has an energy deficit, and oceans retain their energy and are generally warmer than continents. Air forced to rise above the oceans is therefore warmer than that rising over the continents. As a result, the air over the oceans is more likely to rise, and the associated low-pressure zone tends to be stronger over the oceans than over the land.
10. The cold, dense, descending air over the poles produces a zone of high air pressure. This zone has a large energy deficit. In such zones, continents lose their energy faster, and are therefore cooler, than the adjacent polar oceans, so air pressures are extremely high over the cold continents. The slightly warmer temperatures of the adjacent oceans diminishes somewhat in these high air pressures.
How Does Sea-Level Air Pressure Vary Globally?
Average Annual Air Pressure
1. This map shows sea-level equivalent air pressure averaged for 1981 to 2010. Observe the main pattern and compare larger patterns on this map?
2. Two belts of high pressure (shown in light gray) encircle the globe at about 30° N and 30° S (the subtropics). Between these two is a belt of lower pressure (shown in medium gray) straddling the equator, in the tropics. The equatorial low pressure and flanking high-pressure zones are due to the large air current that rises in the tropics and descends in the subtropics.
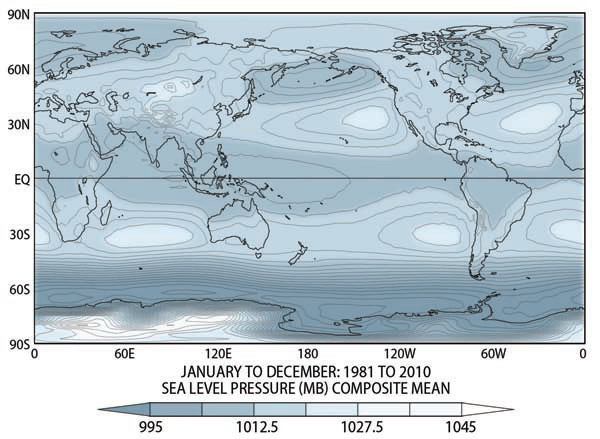
3. A set of low-pressure areas occurs near 60° N. Note that the lows are best developed in the oceans, and are poorly developed on land.
4. A prominent air-pressure feature on this map is a belt of extremely low pressure (shown in dark gray) in the ocean just off Antarctica. This belt is so well developed in the Southern Hemisphere because of the abundant ocean surface, uninterrupted by continental landmasses at this latitude (60° S). An intense high-pressure belt (very light gray) occurs over continental Antarctica, in contrast to the oceanic Arctic.
January Air Pressure
5. Patterns of air pressure change with the seasons, following changes in insolation patterns. In January, one of the most prominent air-pressure features is a high-pressure area over Siberia, Russia, called the Siberian High. As discussed later, this high pressure helps drive the monsoon that affects much of southern Asia.
6. The broad belt of tropical low pressure moves toward the Southern Hemisphere, following the direct rays of the Sun (remember that January is in the southern summer). The migration is particularly noticeable over the hot land surfaces, like Australia.
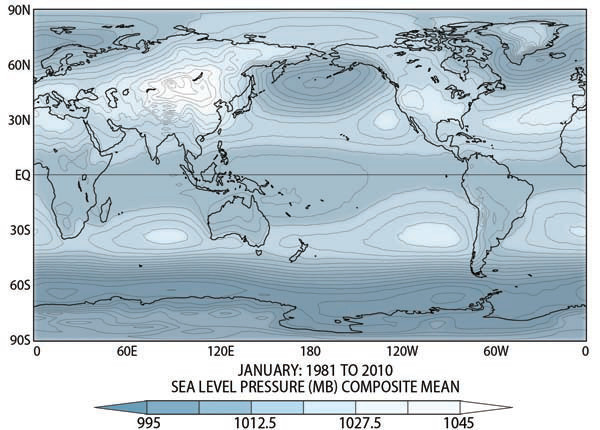
7. A large area of low pressure, called the Icelandic Low, develops over the northern Atlantic Ocean, wrapping around Greenland. As ocean waters retain their heat better at this cold time of year, a similar low, the Aleutian Low, develops in the northern Pacific Ocean west of Canada.
8. Elongated highs (shown in light gray) occur over the oceans in the Southern Hemisphere subtropics, but not over the adjacent continents. The highs are enhanced by the relatively cool oceans in this region. Farther south is the pronounced belt of low pressure in the cold oceans that encircle Antarctica.
July Air Pressure
9. Air-pressure patterns change markedly by July, the northern summer. In the Northern Hemisphere, the Siberian High has dissipated as warm air over interior Asia rises. Pressure gradients across the Northern Hemisphere are weaker in July than in January, because the equatorto-pole energy gradient isn't as steep in the summer as it is in the winter.
10. Typical patterns remain in the Southern Hemisphere, with belts of high pressure in the subtropics, flanked to the south by a continuous belt of very low pressure across the southern oceans. High pressure strengthens over the main landmass of Antarctica during the prolonged darkness of the southern winter.
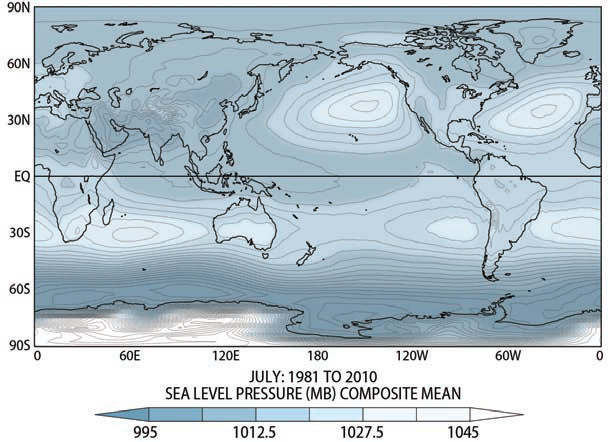
11. Bullseye-shaped high-pressure areas develop over the oceans, one over the central Atlantic (the Bermuda-Azores High) and another in the Pacific near Hawaii (Hawaiian High).
- What Are Some Significant Regional Winds?
- How Do Variations in Temperature and Pressure Cause Local Atmospheric Circulation?
- What Causes Pressure Variations and Winds?