Mapping Global Land Cover by Satellite
Imagine yourself as an astronaut living on an orbiting space station, watching the Earth turn underneath you. One of the first things that would strike you about the land surface is its color and how it changes from place to place and time to time. Deserts are in shades of brown, dotted with white salty playas and the black spots and streaks of recent volcanic activity. Equatorial forests are green and lush, dissected by branching lines of dark rivers. Shrublands are marked by earth colors, but with a greenish tinge.
Some regions show substantial change throughout the year. In the midlatitude zone, forests and agricultural lands go from intense green in the summer to brown as leaves drop and crops are harvested. Snow expands equatorward in the fall and winter and retreats poleward in the spring and summer. In the tropical zones, grasslands and savannas go from brown to green to brown again as the rainy season comes and goes. Some features, such as lakes, remain nearly unchanged throughout the year. Ever since the first satellite images of the Earth were received, scientists have used color—and the change of color with time—as an indicator of land-cover type.
For example, there is a 30-year history of producing land-cover maps for local areas using individual Landsat images from cloud-free dates. But global-scale mapping of land cover requires instruments like MODIS that can observe the surface on a daily or near-daily basis to acquire cloud-free images of regions that are frequently cloud-covered.
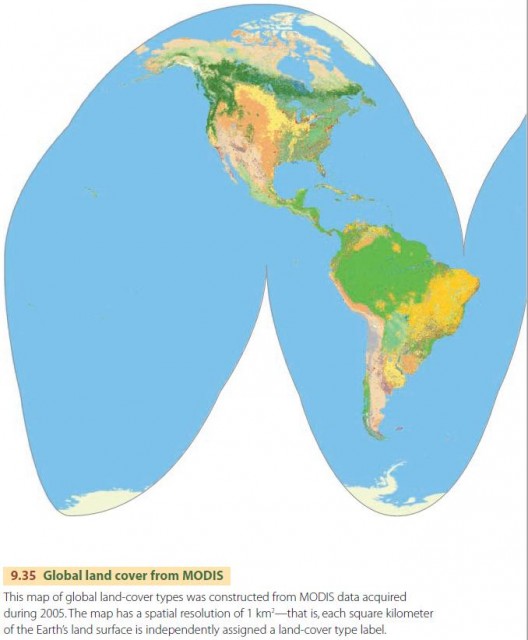
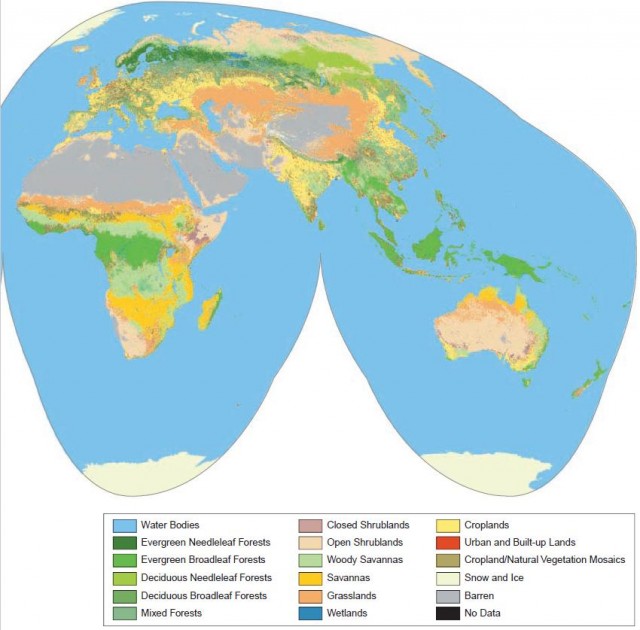
Figure 9.35 is a map of global land cover produced from MODIS images for the year 2005. The legend recognizes 17 types of land covers, including forests, shrublands, savannas, grasslands, and wetlands. The global pattern of land-cover types is rather similar to Figure 9.7. Evergreen broadleaf forest dominates the equatorial belt, stretching from South America, through Central Africa, to south Asia. Adjoining the equatorial forest belt are regions of savannas and grasslands, which have strong wet-dry climates. The vast desert region running from the Sahara to the Gobi is barren or sparsely vegetated. It is flanked by grasslands on the west, north, and east. Broadleaf deciduous forests are prominent in eastern North America, western Europe, and eastern Asia. Evergreen needleleaf forests span the boreal zone from Alaska and northwest Canada to Siberia. Croplands are found throughout most regions of human habitation, except for dry desert regions and cold boreal zones.
The MODIS map was constructed from both color (spectral) and time-based (temporal) information using a process called classification. In short, a computer program is presented with many images of each land-cover type. It then “learns” the examples and uses them to classify pixels depending on their spectral and temporal pattern. The MODIS global landcover map shown was prepared with more than 2500 examples of the 17 land-cover types. It is estimated to be 75 to 80 percent accurate.
Land-cover mapping is a common application of remote sensing. Given the ability of spaceborne instruments to image the Earth consistently and repeatedly, classification of remotely sensed data is a natural way of extending our knowledge from the specific to the general to provide valuable new geographic information.