Population Geography
A HUMAN PERSPECTIVE In 1999, the world's population reached 6 billion people. To get an idea of how many people that is, consider this: If you had a million dollars in thousand dollar bills, the stack would be 6.3 inches high. If you had a billion dollars in thousand dollar bills, the stack would be 357 feet high, or about the length of a football field including the end zones. Now multiply by 6. Six billion dollars would be almost 6 football fields high.
At the world's natural growth rate in 1999, that 6 billion population figure was reached by the births of 230,000 people each day.
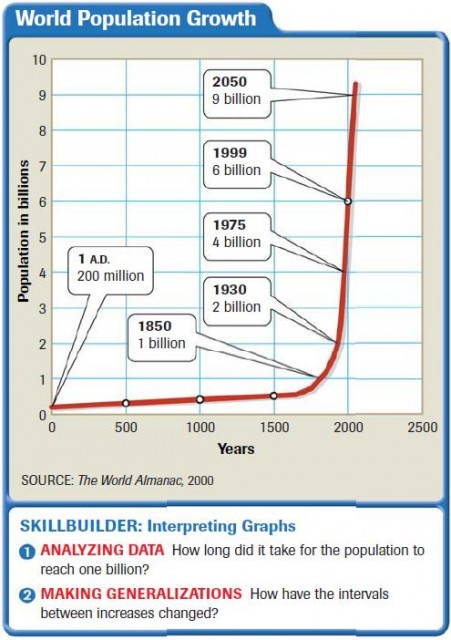
Worldwide Population Growth
The earth's population hit the one billion mark in the early 1800s. As the world industrialized, people grew more and better food and improved sanitation methods, and the population of the world began to soar. As more and more women reached childbearing age, the number of children added to the population also increased. As you can see in the diagram at the right, by 1930 two billion people lived on the earth. Notice that the number of years between each billion mark gets smaller.
BIRTH AND DEATH RATES
A population geographer studies aspects of population such as birth and death rates, distribution, and density. To understand population growth, geographers calculate several different statistics. One is the birthrate, which is the number of live births per thousand population. In 2000, the highest birthrate in the world was more than 54 per thousand in Niger, and the lowest rate was about 8 per thousand in Latvia. The world average birthrate is 22 per thousand.
Another way to study population is to look at the fertility rate. The fertility rate shows the average number of children a woman of childbearing years would have in her lifetime, if she had children at the current rate for her country. A fertility rate of 2.1 is necessary just to replace current population. Today, the worldwide average fertility rate is about 3.0.
The mortality rate—also called the death rate—is the number of deaths per thousand people. In general, a society is considered healthy if it has a low mortality rate. However, some healthy nations have higher mortality rates because they have large numbers of elderly people.
For this reason, geographers also look at infant mortality rates in measuring how healthy the people of a nation are. The infant mortality rate shows the number of deaths among infants under age one per thousand live births. In the 1800s, the worldwide infant mortality rate was about 200 to 300 deaths per thousand live births. At the beginning of the 21st century, improved health care and nutrition led to a much lower rate worldwide. However, some parts of the world still record as many as 110 infant deaths per thousand. To find the rate at which population is growing, subtract the mortality rate from the birthrate. The difference is the rate of natural increase, or population growth rate.
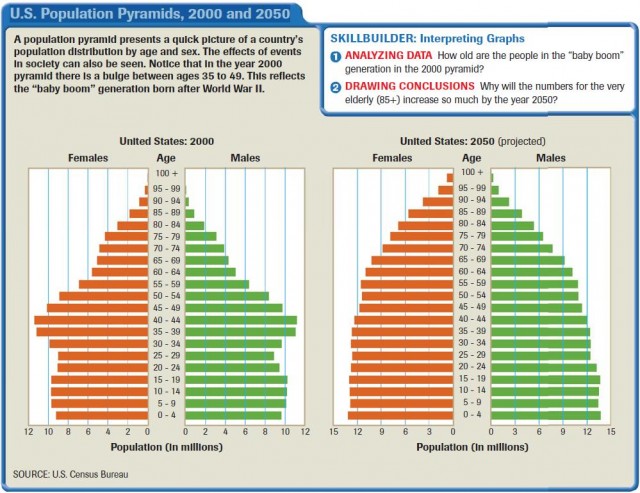
POPULATION PYRAMID
Another way to analyze populations is to use a population pyramid, a graphic device that shows sex and age distribution of a population. A population pyramid allows geographers to examine how events in society, such as wars, famine, or epidemics, affect the population of a country or region. Study the population pyramids shown above to learn how to interpret these graphics.
Population Distribution
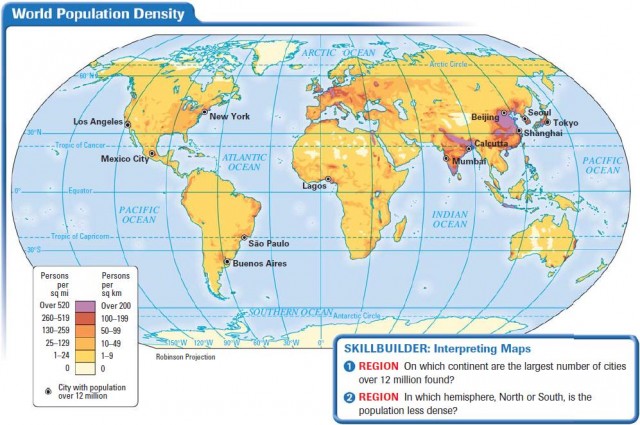
The billions of people in the world are not distributed equally across the earth. Some lands are not suitable for human habitation. In fact, almost 90 percent of the world's population lives in the Northern Hemisphere. One in four people in the world lives in East Asia, and one of every two people lives in either East Asia or South Asia. Several factors, including climate, altitude, and access to water, influence where people live.
HABITABLE LANDS
Almost two-thirds of the world's population lives in the zone between 20° N and 60°N latitude. Some of the lands in this zone have suitable climate and vegetation for dense human habitation. They are warm enough and wet enough to make agriculture possible. In addition, populations are concentrated along coastal regions and river valleys. The lightly populated areas are in polar regions, heavily mountainous regions, and desert regions.
URBAN–RURAL MIX
Currently, more than half of the world's population lives in rural areas, but that number is changing rapidly. More people are moving into cities—particularly cities with populations of more than one million people. Twenty-six giant cities, called megacities, are home to a total of more than 250 million people. The largest of these is Tokyo, with more than 28 million inhabitants. These huge cities struggle with overcrowded conditions and immense demand for water and sanitation.
MIGRATION
The large-scale migration of people from one location to another also alters the distribution of population. Reasons for migrating are sometimes referred to as push-pull factors. Push factors are those that cause people to leave their homeland and migrate to another region. Environmental conditions, such as drought or other natural disasters, are examples of push factors. Other push factors are political, such as war or the persecution of certain groups of people for ethnic or religious reasons.
For example, more than one million Rwandans left their country for other parts of Africa in the wake of a civil war there in 1994. Pull factors draw or attract people to another location. Countries with good economic opportunities and high salaries are the likely destinations for migrants. Favorable climate is another pull factor.
Population Density
To understand how heavily populated an area is, geographers use a figure called population density. This figure is the average number of people who live in a measurable area, such as a square mile. The number is reached by dividing the number of inhabitants in an area by the total amount of land they occupy.
Because population is not distributed evenly across the land, the number may be misleading for an entire nation. Certain areas may be densely populated, while others are quite thinly populated. For example, according to the 1990 census, the population density of the United States was 70.3 people per square mile. But as you can see on the population density table on the next page, Alaska—with its huge land area and small population—had a density of one person per square mile. On the other hand, New Jersey, with a small land area and large population, had a very high density at 1,098 people per square mile. Remember, too, that population density may change over time.
CARRYING CAPACITY
Another aspect of population density statistics is the ability of the land to support a population. Carrying capacity is the number of organisms a piece of land can support. A region with fertile land may be able to support far more people than one with land of poor quality or with little land available for cultivation.
The level of technology of a group living on the land may affect carrying capacity. Improved farming techniques, such as irrigation, use of fertilizers, and mechanized farm equipment, will generally increase the carrying capacity of land. In some locations, few if any people make their living by farming.
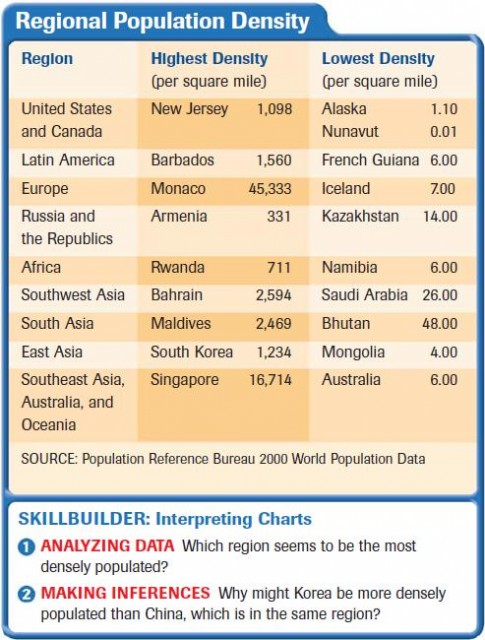
However, other aspects of their economy allow a small area of land to support a large number of people. Notice the density of Singapore shown in the chart at left. A city state located at the tip of Malaysia, Singapore is a center of international finance and shipping. The wealth these activities bring allows people to import food. Thus, Singapore is able to support millions of people even though it has little farmable land. In the next section, you'll learn how the world's population forms into political units.