Surface and Air Temperature
This chapter focuses on air temperature—that is, the temperature of the air as observed at 1.2 m (4 ft) above the ground surface. Air temperature conditions many aspects of human life, from the clothing we wear to the fuel costs we pay. Air temperature and air temperature cycles also act to select the plants and animals that make up the biological landscape of a region. And air temperature, along with precipitation, is a key determiner of climate, which we will explore in more depth in Chapter 7.
Five important factors influence air temperature:
- Latitude. Daily and annual cycles of insolation vary systematically with latitude, causing air temperatures and air temperature cycles to vary as well. Yearly insolation decreases toward the poles, so less energy is available to heat the air. But because the seasonal cycle of insolation becomes stronger with latitude, high latitudes experience a much greater range in air temperatures through the year.
- Surface type. Urban air temperatures are generally higher than rural temperatures. City surface materials—asphalt, roofing shingles, stone, brick—hold little water, compared to the moist soil surfaces of rural areas and forests, so there is little cooling through evaporation. Urban materials are also darker and absorb a greater portion of the Sun's energy than vegetation-covered surfaces. The same is true for areas of barren or rocky soil surfaces, such as those of deserts.
- Coastal or interior location. Locations near the ocean experience a narrower range of air temperatures than locations in continental interiors. Because water heats and cools more slowly than land, air temperatures over water are less extreme than temperatures over land. When air flows from water to land, a coastal location will feel the influence of the adjacent water.
- Elevation. Temperature decreases with elevation. At high elevation, there is less atmosphere above the surface, and greenhouse gases provide a less effective insulating blanket. More surface heat is lost to space. On high peaks, snow accumulates and remains longer. The reduced greenhouse effect also results in greater daily temperature variation.
- Atmospheric and oceanic circulations. Local temperatures can rise or fall rapidly when air from one region is brought into another. Temperatures of coastal regions can be influenced by warm or cold coastal currents. (We will investigate this factor more fully in Chapter 5.)
SURFACE TEMPERATURE
Temperature is a familiar concept. It is a measure of the level of kinetic energy of the atoms in a substance, whether it is a gas, liquid, or solid. When a substance receives a flow of radiant energy, such as sunlight, its temperature rises. Similarly, if a substance loses energy, its temperature falls. This energy flow moves in and out of a solid or liquid substance at its surface—for example, the very thin surface layer of soil that actually absorbs solar shortwave radiation and radiates longwave radiation out to space.
The temperature of a surface is determined by the balance among the various energy flows that move across it. Net radiation—the balance between incoming shortwave radiation and outgoing longwave radiation—produces a radiant energy flow that can heat or cool a surface. During the day, incoming solar radiation normally exceeds outgoing longwave radiation, so the net radiation balance is positive and the surface warms. Energy flows through the surface into the cooler soil below. At night, net radiation is negative, and the soil loses energy as the surface temperature falls and the surface radiates longwave energy to space.
Energy may also move to or from a surface in other ways. Conduction describes the flow of sensible heat from a warmer substance to a colder one through direct contact. When heat flows into the soil from its warm surface during the day, it flows by conduction. At night, heat is conducted back to the colder soil surface. Latent heat transfer is also important. When water evaporates at a surface, it removes the heat stored in the change of state from liquid to vapor, thus cooling the surface. When water condenses at a surface, latent heat is released, warming the surface.
Another form of energy transfer is convection, in which heat is distributed in a fluid by mixing. If the surface is in contact with a fluid, such as a soil surface with air above, upward- and downward-flowing currents can act to warm or cool the surface.
AIR TEMPERATURE
In contrast to surface temperature is air temperature, which is measured at a standard height of 1.2 m (4.0 ft) above the ground surface. Air temperature can be quite different from surface temperature. When you walk across a parking lot on a clear summer day, you will notice that the pavement is a lot hotter than the air against the upper part of your body. In general, air temperatures above a surface reflect the same trends as ground surface temperatures, but ground temperatures are likely to be more extreme.
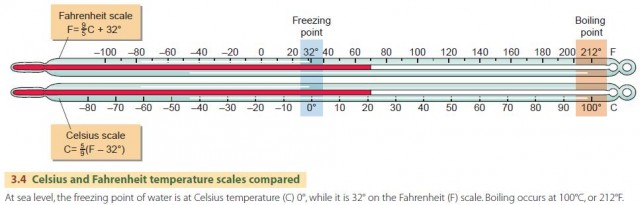
In the United States, temperature is still widely measured and reported using the Fahrenheit scale. In this book, we use the Celsius temperature scale, which is the international standard. On the Celsius scale, the freezing point of water is 0°C and the boiling point is 100°C. Conversion formulas between these two scales are given in Figure 3.4.
Air temperature measurements are made routinely at weather stations. Although some weather stations report temperatures hourly, most only report the highest and lowest temperatures recorded during a 24-hour period. These are the most important values in observing long-term trends in temperature.
Temperature measurements are reported to governmental agencies charged with weather forecasting, such as the U.S. Weather Service or the Meteorological Service of Canada. These agencies typically make available daily, monthly, and yearly temperature statistics for each station using the daily maximum, minimum, and mean temperature. The mean daily temperature is defined as the average of the maximum and minimum daily values. The mean monthly temperature is the average of mean daily temperatures in a month. These statistics, along with others such as daily precipitation, are used to describe the climate of the station and its surrounding area.
TEMPERATURES CLOSE TO THE GROUND
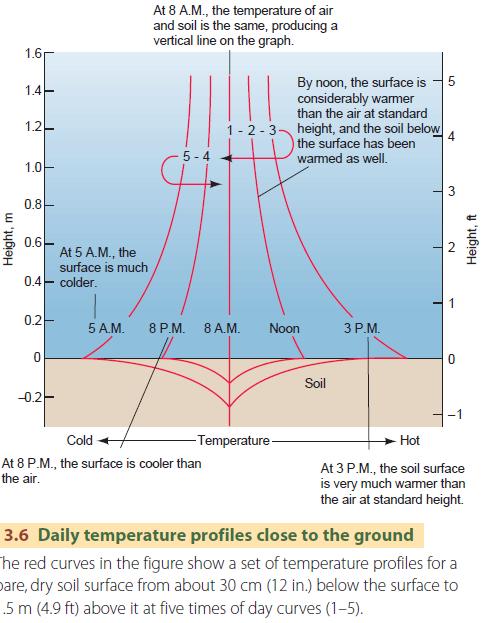
Soil, surface, and air temperatures within a few meters of the ground change through the day (Figure 3.6). The daily temperature variation is greatest just above the surface. The air temperature at standard height is far less variable. In the soil, the daily cycle becomes gradually less pronounced with depth, until we reach a point where daily temperature variations on the surface cause no change at all.
ENVIRONMENTAL CONTRASTS: URBAN AND RURAL TEMPERATURES
On a hot day, rural environments will feel cooler than urban environments. In rural areas, water is taken up by plant roots and moves to the leaves in a process called transpiration. This water evaporates, cooling leaf surfaces, which in turn cool nearby air. Soil surfaces are moist because water seeps into the soil during rainstorms. It is drawn upward and evaporates when sunlight warms the surface, again producing cooling. We refer to the combined effects of transpiration and evaporation as evapotranspiration.
There are other reasons why urban surfaces are hotter than rural ones. Many city surfaces are dark and absorb rather than reflect solar energy. In fact, asphalt paving absorbs more than twice as much solar energy as vegetation. Rain runs off the roofs, sidewalks, and streets into storm sewer systems. Because the city surfaces are dry, there is little evaporation to help lower temperatures. Another important factor is waste heat. In summer, city air temperatures are raised by air conditioning, which pumps heat out of buildings and releases it to the air.
In winter, heat from buildings and structures is conducted directly to the urban environment.
THE URBAN HEAT ISLAND
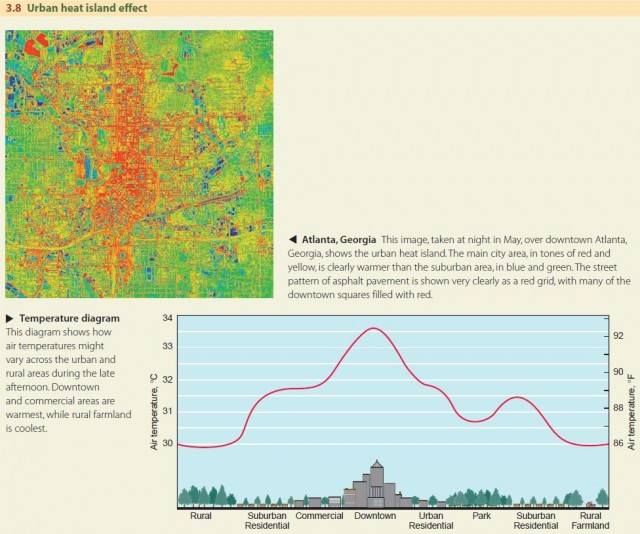
As a result of these effects, air temperatures in the central region of a city are typically several degrees warmer than those of the surrounding suburbs and countryside, as shown in Figure 3.8. The sketch of a temperature profile across an urban area in the late afternoon shows this effect. We call the central area an urban heat island, because it has a significantly elevated temperature. Such a large quantity of heat is stored in the ground during the daytime hours that the heat island remains warmer than its surroundings during the night, too. The thermal infrared image of the Atlanta central business district at night demonstrates the heat island effect.
The urban heat island effect has important economic consequences. Higher temperatures demand more air conditioning and more electric power in the summer. The fossil fuel burned to generate this power contributes CO2 and air pollutants to the air. The increased temperatures can lead to smog formation, which is unhealthy and damaging to materials. To reduce these effects, many cities are planting more vegetation and using more reflective surfaces, such as concrete or bright roofing materials, to reflect solar energy back to space.
The heat island effect does not necessarily apply to cities in desert climates. In the desert, the evapotranspiration of the irrigated vegetation of the city may actually keep the city cooler than the surrounding barren region.
HIGH-MOUNTAIN ENVIRONMENTS
We have seen that the ground surface affects the temperature of the air directly above it. But what happens as you travel to higher elevations? For example, as you climb higher on a mountain, you may become short of breath and you might notice that you sunburn more easily. You also feel the temperature drop, as you ascend. If you camp out, you'll see that the nighttime temperature gets lower than you might expect, even given that temperatures are generally cooler the farther up you go.
What causes these effects? At high elevations there is significantly less air above you, so air pressure is low. It becomes harder to catch your breath simply because of the reduced oxygen pressure in your lungs. And with fewer molecules to scatter and absorb the Sun's light, the Sun's rays will feel stronger. There is less carbon dioxide and water vapor, and so the greenhouse effect is reduced. With less warming, temperatures will tend to drop even lower at night. Later in this chapter, we will see how this pattern of decreasing air temperature extends high up into the atmosphere.
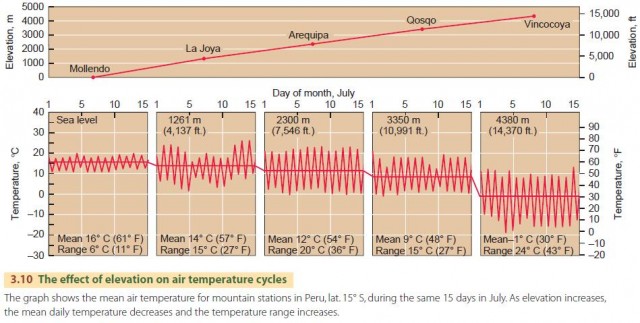
Figure 3.10 shows temperature graphs for five stations at different heights in the Andes Mountain Range in Peru. Mean temperatures clearly decrease with elevation, from 16°C (61°F) at sea level to ?1°C (30°F) at 4380 m (14,370 ft). The range between maximum and minimum temperatures also increases with elevation, except for Qosqo. Temperatures in this large city do not dip as low as you might expect because of its urban heat island.
TEMPERATURE INVERSION
So far, air temperatures seem to decrease with height. But is this always true? Think about what happens on a clear, calm night. The ground surface radiates longwave energy to the sky, and net radiation becomes negative. The surface cools. This means that air near the surface also cools, as we saw in Figure 3.6. If the surface stays cold, a layer of cooler air above the ground will build up under a layer of warmer air, as shown in Figure 3.11. This is a temperature inversion.
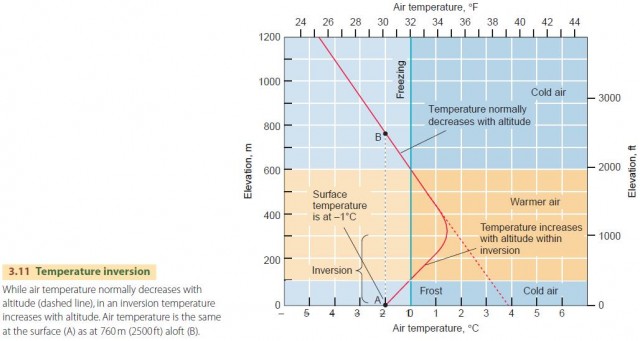
In a temperature inversion, the temperature of the air near the ground can fall below the freezing point. This temperature condition is called a killing frost—even though actual frost may not form—because of its effect on sensitive plants during the growing season.
Growers of fruit trees or other crops use several methods to break up an inversion. Large fans can be used to mix the cool air at the surface with the warmer air above, and oilburning heaters are sometimes used to warm the surface air layer.
TEMPERATURE INDEXES
Temperature can also be used with other weather and climate data to produce temperature indexes—indicators of the temperature's impact upon environmental and human conditions. Two of the more familiar indexes are the wind chill index and the heat index.
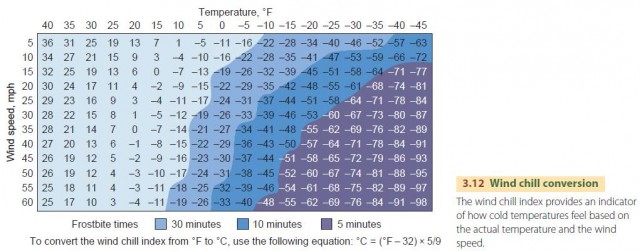
The wind chill index is used to determine how cold temperatures feel to us, based on not only the actual temperature but also the wind speed. Air is actually a very good insulator, so when the air is still, our skin temperature can be very different from the temperature of the surrounding environment. However, as air moves across our skin, it removes sensible and latent heat and transports it away from our bodies. During the summer, this process keeps us cool as sweat is evaporated away, lowering our skin temperature. During the winter, it removes heat necessary to keep our bodies warm, thereby cooling our skin and making conditions feel much colder than the actual measured temperature.
The wind chill index, which is used in the United States and measured in °F, can be very different from the actual temperature (Figure 3.12). For example, an actual temperature of 30°F (?1°C) and a wind speed of 30 mi/hr (13.45 m/s) produce a wind chill of 15°F (?26°C).
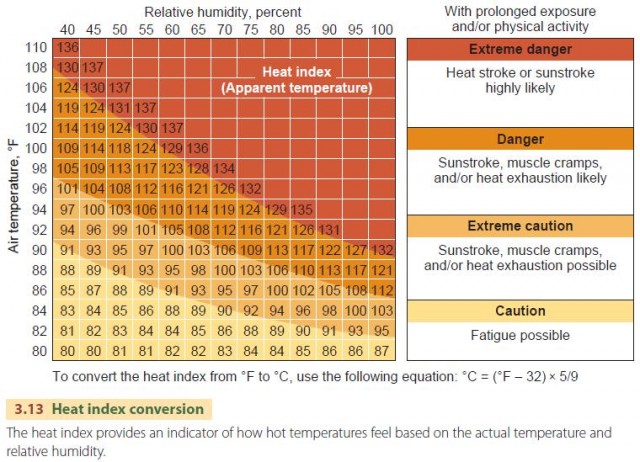
The heat index gives an indication of how hot we feel based on the actual temperature and the relative humidity. Relative humidity is the humidity given in most weather reports and indicates how much water vapor is in the atmosphere as a percentage of the maximum amount possible. Low relative humidity indicates relatively dry atmospheric conditions, while high relative humidity indicates relatively humid atmospheric conditions.
Why does relative humidity influence how hot the temperature feels? One of the ways our bodies remove excess heat is through the evaporation of sweat from our skin. This evaporation removes latent heat, which cools our bodies. However, when the relative humidity is high, less evaporation occurs because the surrounding atmosphere is already relatively moist, and the cooling effect is reduced.
The heat index is given in °F, and, like the wind chill, it can be very different from the actual temperature (Figure 3.13). For example, if the actual temperature is 90°F (32°C) and the relative humidity is 90 percent, the heat index indicates that the temperature will feel like 122°F (50°C)—a difference of 32°F (18°C)!
- Carbon Dioxide — On the Increase
- CERES—Clouds and the Earth’s Radiant Energy System
- Net Radiation, Latitude, and the Energy Balance
- The Global Energy System
- What Processes Affect Ocean Temperature and Salinity in Tropical and Polar Regions?
- What Are the Global Patterns of Temperature and Salinity?
- How Do Sea-Surface Temperatures Vary from Place to Place and Season to Season?
- How Do Variations in Temperature and Pressure Cause Local Atmospheric Circulation?