Thematic Maps
Geographers also rely on thematic maps, which focus on specific types of information. For example, in this textbook you will see thematic maps that show climate, vegetation, natural resources, population density, and economic activities. Some thematic maps illustrate historical trends, and others may focus on the movement of people or ideas. These maps may be presented in a variety of ways.
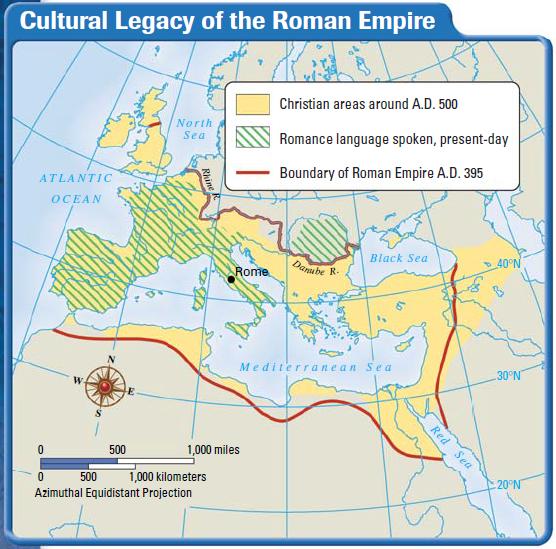
QUALITATIVE MAPS
Qualitative maps use colors, symbols, dots, or lines to help you see patterns related to a specific idea. The map shown to the left shows the influence of the Roman Empire on Europe, North Africa, and Southwest Asia. Use the suggestions below to help you interpret a map.
- Check the title to identify the theme and data being presented.
- Study the legend to understand the theme and the information presented.
- Look at physical or political features of the area. How might the theme of the map affect them?
- What are the relationships among the data?
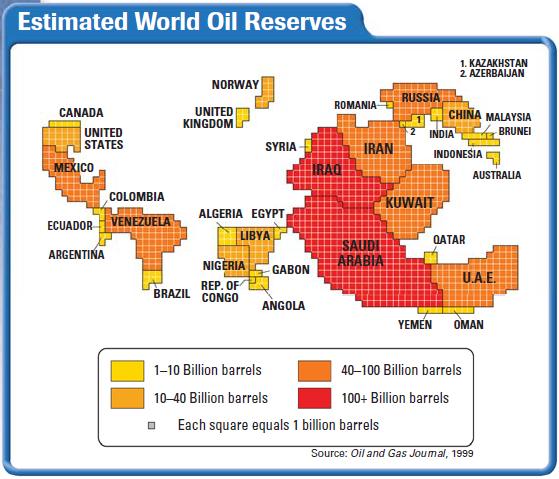
CARTOGRAMS
In a cartogram, geographers present information about a country based on a set of data other than land area. The size of each country is drawn in proportion to that data rather than to its land size. On the cartogram shown to the left, the countries are represented on the basis of their oil reserves. Use the suggestions below to help you interpret a cartogram.
- Check the title and legend to identify the data being presented.
- What do sizes represent?
- Look at the relative sizes of the countries shown. Which is largest? smallest?
- How do the sizes of the countries on the physical map differ from those in the cartogram?
- What are the relationships among the data?
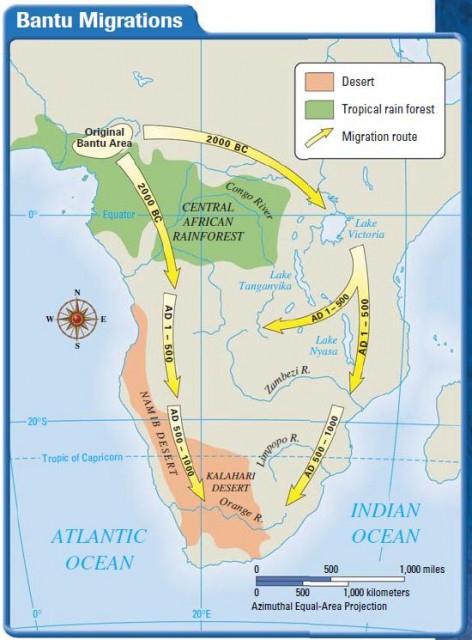
FLOW-LINE MAPS
Flow-line maps illustrate movement of people, goods, ideas, animals, or even glaciers. The information is usually shown in a series of arrows.
Location, direction, and scope of movement can be seen. The width of the arrow may show how extensive the flow is. Often the information is given over a period of time. The map shown to the right portrays the movement of the Bantu peoples in Africa. Use the suggestions below to help you interpret a
flow-line map.
- Check the title and legend to identify the data being presented.
- Over what period of time did the movement occur?
- In what direction did the movement occur?
- How extensive was the movement?
Remember that the purpose of a map is to show a location and provide additional information. Be sure to look at the type of map, scale, and projection. Knowing how maps present the information will help you interpret the map and the ideas it presents.