Tropical and Equatorial Weather Systems
So far, we have discussed weather systems of the midlatitudes and poleward. Weather systems of the tropical and equatorial zones show some basic differences from those of the midlatitudes. Upper-air winds are often weak, so air-mass movement is slow and gradual. Air masses are warm and moist, and different air masses tend to have similar characteristics, so fronts are not as clearly defined. Without the strong temperature gradients across unlike air masses, there are no large, intense upper-air disturbances. On the other hand, the high moisture content leads to intense convective activity in low-latitude maritime air masses. Because these air masses are very moist, only slight convergence and uplift are needed to trigger precipitation.
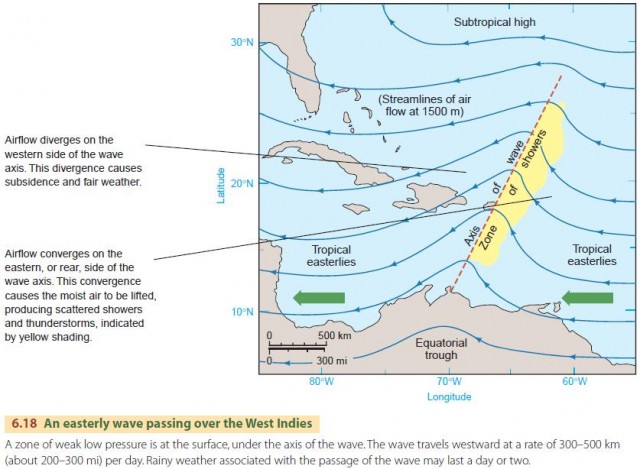
One of the simplest forms of tropical weather systems is an easterly wave—a slowly moving trough of low pressure within the belt of tropical easterlies (the trade winds). These waves occur in latitudes 5°–30° N and S over oceans, but not over the Equator itself. Figure 6.18 shows circulations and weather features associated with an easterly wave.
Another related weather system is the weak equatorial low—a disturbance that forms near the center of the equatorial trough. Moist equatorial air masses converge on the center of the low, causing rainfall from many individual convectional storms. Several such weak lows usually lie along the ITCZ.
TROPICAL CYCLONES
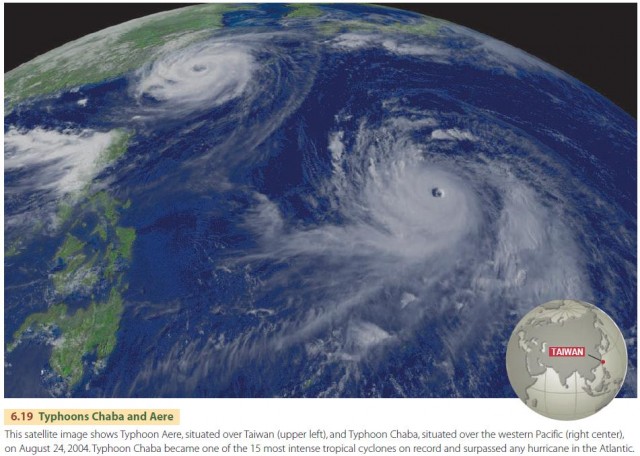
The tropical cyclone is the most powerful and destructive type of cyclonic storm (Figure 6.19). It is known as a hurricane in the western hemisphere, a typhoon in the western Pacific off the coast of Asia, and a cyclone in the Indian Ocean. This type of storm typically develops over oceans between 10° and 20° N and S latitudes and no closer than 5° from the Equator.
A tropical cyclone can originate as an easterly wave or weak low that intensifies and grows into a deep, circular low. It can also form as upper-air disturbances in the subtropical jet stream move south into the tropical regions. Once formed, the storm moves westward through the trade-wind belt, often intensifying as it travels. It can then curve poleward and eastward, steered by winds aloft. Tropical cyclones can penetrate well into the midlatitudes, as many residents of the southern and eastern coasts of the United States have experienced.
Tropical cyclones grow from tropical depressions, which are cyclones with winds below 17 m/s (39 mph). They intensify into tropical storms with winds of 18–33 m/s (40–74 mph). When winds exceed 33 m/s (74 mph), a tropical storm becomes a tropical cyclone.
An intense tropical cyclone is an almost-circular storm center of extremely low pressure (Figure 6.20). Because of the very strong pressure gradient, winds spiral inward at high speed. Convergence and uplift are intense, producing very heavy rainfall. The storm gains its energy through the release of latent heat as the intense precipitation forms. The storm's diameter may be 150–500 km (about 100–300 mi). Wind speeds can range from 30 to 50 m/s (about 65 to 135 mi/hr) and sometimes much higher. Barometric pressure in the storm center commonly falls to 950 mb (28.1 in. Hg) or lower.
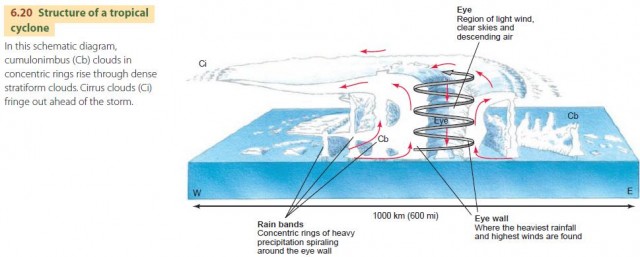
Another characteristic feature of a well-developed tropical cyclone is its central eye, in which clear skies and calm winds prevail. The eye is a cloud-free vortex produced by the intense spiraling of the storm. Around the eye, the wind is spinning so fast that it cannot converge into the center. Here in the eye, air descends from high altitudes and is adiabatically warmed, causing reevaporation of cloud droplets. As the eye passes over a site, calm prevails, and the sky is clear. It may take about half an hour for the eye to pass, after which the storm strikes with renewed ferocity but with winds in the opposite direction. Wind speeds and precipitation are highest along the cloud wall surrounding the eye. However, precipitation can also be intense in the rain bands that extend in concentric circles away from the hurricane.
TROPICAL CYCLONE DEVELOPMENT
Why do tropical cyclones become so intense? The intensification is due to positive feedback between the ocean and atmosphere, described in Figure 6.21, that allows the atmosphere to draw in massive amounts of energy stored in the ocean.
As an easterly wave moves over the warm ocean waters of the low latitudes, the convergence at the surface results in convective lifting. This lifting subsequently results in condensation, which releases latent heat that warms the surrounding air and produces even greater convection. As the convection intensifies, it further lowers the pressure at the surface. The result is enhanced convergence of warm, moist air, which supplies even more latent heat to the system as the air is lifted. As the low pressure at the surface continues to drop, the inspiraling winds intensify, producing the ferocious winds described in the chapter opening.
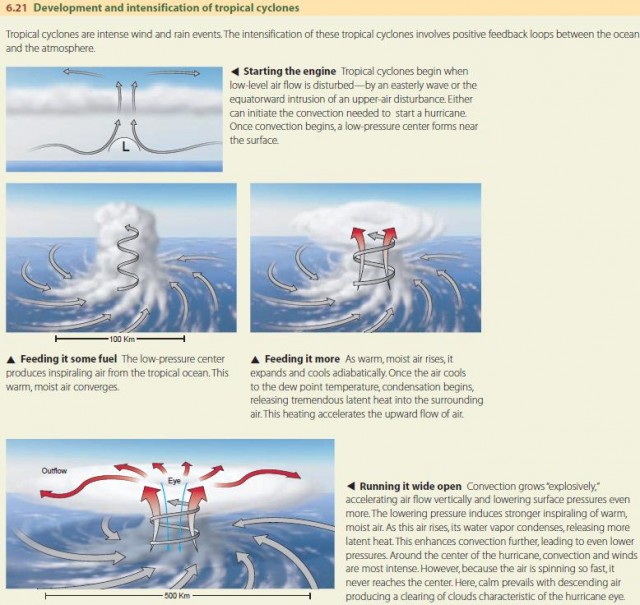
Another reason for the very intense winds is weakness of the Coriolis force at the latitudes at which tropical cyclones are located. Looking at Figure 6.21, the pressure gradient force on a moving parcel of air has to be balanced by the Coriolis force, which depends on the parcel's speed. Because the force is weaker at low latitudes, the parcel has to go faster to generate a force that balances the same amount of pressure gradient force. Thus, wind speeds in tropical cyclones can become much higher than in traveling cyclones of the midlatitudes.
TROPICAL CYCLONE TRACKS
Tropical cyclones occur only during certain seasons. For hurricanes of the North Atlantic, the season typically runs from June through November, with maximum frequency in late summer or early autumn. In the southern hemisphere, the season is roughly the opposite. These periods follow the annual migrations of the ITCZ to the north and south with the seasons, and correspond to periods when ocean temperatures are warmest.
Most of the storms originate at 10°–20° N and S latitude and tend to follow known tropical cyclone tracks (Figure 6.22). In the northern hemisphere, they most often travel westward and northwestward through the trade winds, and then turn northeast at about 30°–35° N latitude into the zone of the westerlies. Here their intensity lessens, especially if they move over land. In the trade-wind belt, the cyclones typically travel at 10–20 km (6–12 mi) per hour. In the zone of the westerlies, their speed is more variable.
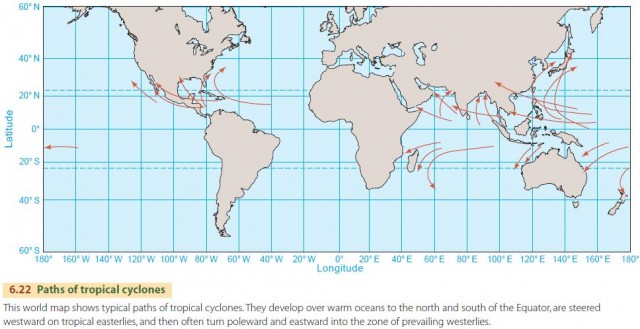
What factors are required for tropical cyclone development? As shown in Figure 6.22, tropical cyclones form over ocean regions in the low latitudes, but not within 5° of the Equator. Here, we find the warm ocean waters, greater than 26.5° C (80° F), that supply the latent and sensible heat needed to drive the tropical cyclone. Also required is an unstable environmental lapse rate, so that convection can easily be initiated by passing easterly waves or upper-air disturbances.
Weak winds with little change in wind speed or direction with height are also needed, so that the large uniform vertical structure of the tropical cyclone can develop. If this uniform structure is disrupted, the tropical cyclone will quickly die out. Finally, the atmosphere must have a high water content through the bottom 5 km (16,000 ft) of the atmosphere. If warm, moist surface air mixes with dry air above, the relative humidity of the air will decrease and the latent heat release needed to sustain the tropical cyclone will be shut down.
What factors prevent the formation of tropical cyclones? Because weak winds are needed, moderate to strong winds above the surface will tend to disrupt the uniform structure of the tropical cyclone. Also, descent of air from above will inhibit convection and the vertical circulations necessary to release latent heat. Finally, if the low is too close to the Equator, the Coriolis force will be too weak to deflect the air motion, and it will rapidly converge into the low-pressure center, evening out the pressure at the surface.
In the western hemisphere, hurricanes originate in the Atlantic off the west coast of Africa, in the Caribbean Sea, or off the west coast of Mexico. In the Indian Ocean, cyclones originate both north and south of the Equator, moving north and west to strike India, Pakistan, and Bangladesh, as well as south and west to strike the eastern coasts of Africa and Madagascar. Typhoons of the western Pacific also form both north and south of the Equator, moving into northern Australia, Southeast Asia, China, and Japan.
Curiously, tropical cyclones almost never form in the South Atlantic or southeast Pacific regions. As a result, South America is not threatened by these severe storms. Once formed, tropical cyclones are given names for convenience as they are tracked by weather forecasters. Male and female names are alternated in an alphabetical sequence that is renewed each season. Different sets of names are used within distinct regions, such as the western Atlantic, western Pacific, or Australian regions. Names are reused, but the names of storms that cause significant damage or destruction are retired from further use.
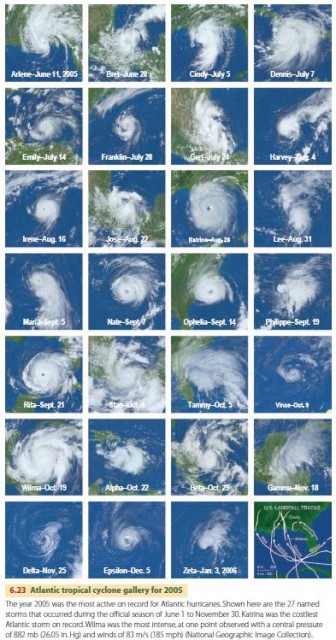
To track tropical cyclones, we now use satellite images. Within these images, tropical cyclones are often easy to identify by their distinctive pattern of inspiraling bands of clouds and a clear central eye. Figure 6.23 shows a gallery of satellite images of the Atlantic tropical cyclones from 2005.
IMPACTS OF TROPICAL CYCLONES
Tropical cyclones can be tremendously destructive storms, with intense rainfall and very strong winds. The effects of wind, sea-level rise, and rain can cause devastation across very large areas. This devastation can occur along the coasts and farther inland along waterways and over mountain ranges, affecting thousands as the tropical cyclone moves along its track.
The intensity of a tropical cyclone is based on the central pressure of the storm, mean wind speed, and height of the accompanying sea-level rise. Storms are ranked from category 1 (weak) to category 5 (devastating) on the Saffir-Simpson scale, shown in Figure 6.24.
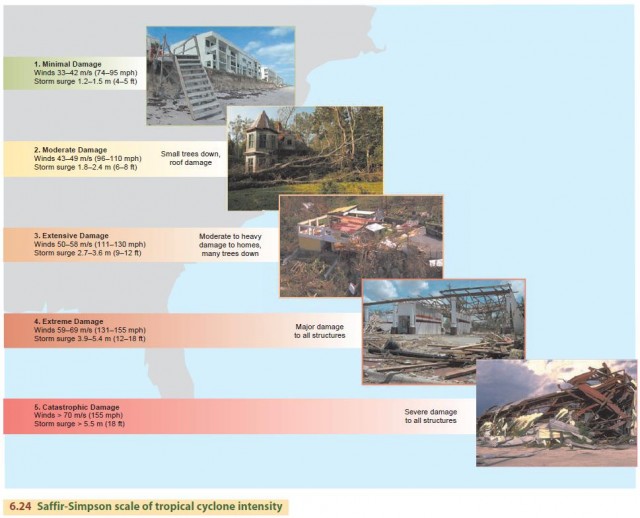
To be classified as a hurricane, a tropical cyclone must have sustained winds of over 33 m/s (74 mph). However, sustained winds in the strongest storms can exceed 70 m/s (about 150 mph) with wind gusts of 90 m/s (about 200 mph) at times.
In addition, rainfall rates can be extremely high. During the passage of some tropical cyclones, 600 mm (2 ft) of rain or more can fall at a location. In some coastal regions, these storms provide much of the summer rainfall. Although this rainfall is a valuable water resource, it can also produce freshwater flooding, raising rivers and streams from their banks. On steep slopes, soil saturation and high winds can topple trees and produce disastrous earthflows.
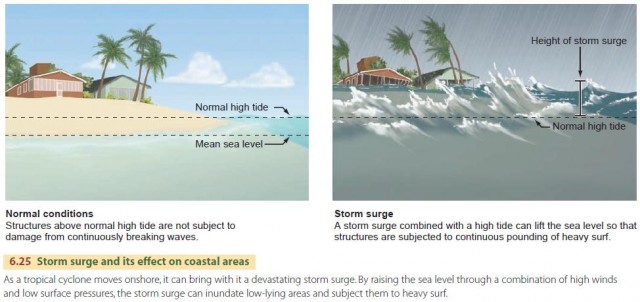
However, the most serious effect of tropical cyclones is usually coastal destruction by storm waves and very high tides, seen in Figure 6.25. Since atmospheric pressure at the center of the cyclone is so low, the sea level rises within the center of the storm. In addition, high winds create damaging surf and push water toward the coast on the side of the storm with onshore winds, raising the sea level even higher. Waves attack the shore at points far inland of the normal tidal range. Low pressure, winds, and the underwater shape of a bay floor can combine to produce a sudden rise of water level known as a storm surge, which carries ocean water and surf far inland. If high tide accompanies the storm, waters will be even higher. For example, low-lying coral atolls of the western Pacific may be entirely swept over by winddriven sea water, washing away palm trees and houses and drowning the inhabitants.
IMPACTS ON COASTAL COMMUNITIES
Coastal residents of South Florida are particularly aware of the damage hurricanes can cause. In 1992, Hurricane Andrew struck the east coast of Florida near Miami. The second most damaging storm to occur in the United States, it claimed 26 lives and caused more than $35 billion in property damage, measured in today's dollars. In 2004, four major hurricanes crossed Florida—Charley, Frances, Ivan, and Jeanne. Taken together, the storms destroyed over 25,000 homes in Florida, with another 40,000 homes sustaining major damage.
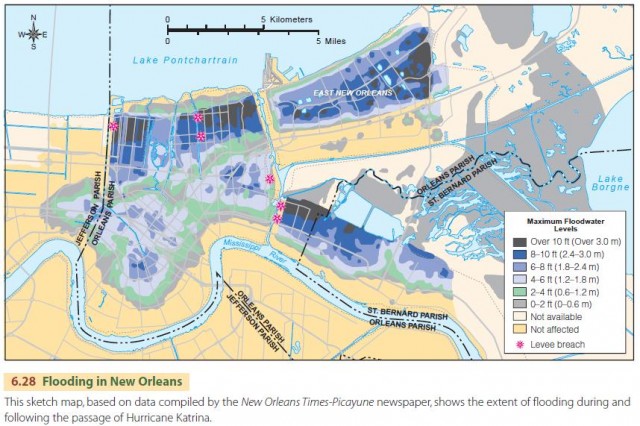
South Florida is not the only coastal region to suffer the devastating effects of hurricanes. In 2005, Hurricane Katrina laid waste to the city of New Orleans and much of the Louisiana and Mississippi Gulf coasts (Figure 6.28).
Originating southeast of the Bahamas, the hurricane first crossed the South Florida peninsula as a category 1 storm, then moved into the Gulf of Mexico, where it intensified to a category 5 storm. Weakening somewhat as it approached the Gulf Coast, its eye came ashore at Grand Isle, Louisiana, with sustained winds of 56 m/s (125 mph) early on August 29.
The city of New Orleans is particularly vulnerable to hurricane flooding. Built largely on the floodplain of the Mississippi River, most of its land area has slowly sunk below sea level as underlying river sediments have compacted through time. In addition, it is a city surrounded by water. Levees protect the city from Mississippi River floods on the south, as well as from ocean waters along the saline Lakes Borgne on the east and Pontchartrain on the north, which are both connected to the Gulf of Mexico. Rainwater falling into the sunken basin is pumped up and out of the city by discharge canals that run through the city itself and out to Lake Pontchartrain. There are also several canals and shipping channels connecting the river with the lakes and the Gulf.
Katrina's first assault was mounted from the east along one of these shipping channels, as a storm surge swept westward from Lake Borgne, overtopping and eroding levees and flooding east New Orleans and St. Barnard Parish. Penetrating deep into the city along the Intracoastal Waterway, the surge also overtopped and breached floodwalls and levees along the main canal connecting the Mississippi River with Lake Pontchartrain. To the north, water levels rose in Lake Pontchartrain, overtopping dikes and levees and filling the discharge canals to dangerously high levels. Eventually, large sections of the canal walls failed, allowing water to pour into the central portion of the city (Figure 6.29). Over the next two days, the water level rose until it equalized with the level of Lake Pontchartrain. Eighty percent of the city was covered with water at depths of up to 6 m (20 ft).
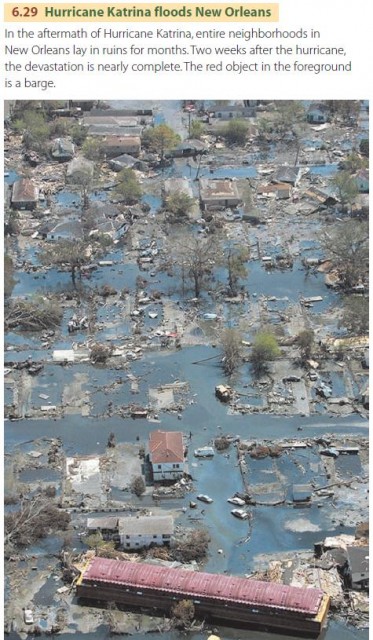
The result was devastation. Total losses were estimated at more than $100 billion. The official death toll exceeded 1300. The Gulf coasts of Mississippi and Louisiana were also hard hit, with a coastal storm surge as high as 8 m (25 ft) penetrating from 10 to 20 km (6–12 mi) inland. Adding insult to injury, much of New Orleans reflooded three weeks later because of Hurricane Rita, a category 3 storm that made landfall on September 24 at the Louisiana–Texas border.