What Happened During Hurricane Sandy?
SEVERE STORMS are extremely dangerous, capable of killing thousands of people and inflicting incomprehensible damage. Severe weather — and the more benign varieties — develop, operate, move, and dissipate according to fundamental principles presented in this chapter. Here, we examine Hurricane Sandy, which in 2012 tracked up the East Coast of the U.S., before coming onshore in New Jersey.
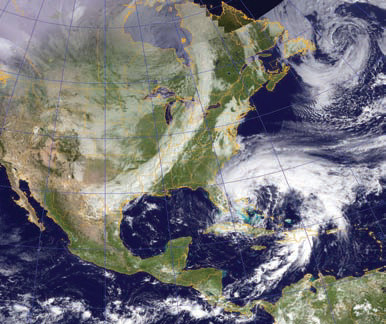
Hurricane Sandy began as a storm in the tropics (tropical cyclone) and became a hurricane that skirted the East Coast of the U.S. before coming onshore in New Jersey on October 29, 2012, as what many in the media and public called “Superstorm Sandy.” On this satellite image, Sandy appears as a swirl of clouds off the East Coast. Clearly visible is a well-defined center of the storm — the eye of the hurricane. To the west of Sandy is a long band of clouds, stretching from Florida to New England. What type of weather system do you think these clouds represent? Sandy later merged with this second weather system, which consisted of a cold front associated with a mid-latitude cyclone centered over New England. Sandy was weakening from hurricane status to tropical storm status as it came on shore, but the interactions with the second weather system had catastrophic results: over $75 billion in damages and nearly 150 deaths, about half in the U.S.
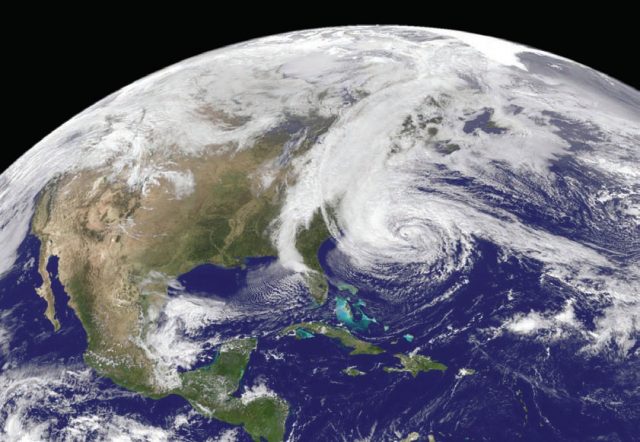
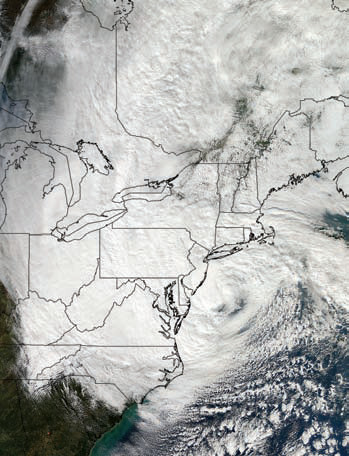
The superstorm was large compared to typical hurricanes, with winds of 65 km (40 miles) per hour extending across an area more than 1,500 km (900 miles) in diameter. In this satellite image, clouds associated with the storm cover the entire northeastern U.S. and large areas of adjacent Canada and the Atlantic Ocean.
Enhanced infrared satellite images, like this colorful map, are a mainstay of daily weather reports. In this map, clouds are shown in light gray where they are relatively thin but blue, green, yellow, and red where thicker, with red being the thickest. We can extract estimates of cloud thicknesses from an infrared image because the temperature of the top of a cloud is mostly a function of how high it is — colder typically means a higher top, greater overall thickness, and more precipitation. Examine this scene and consider what each feature is, why it has the shape it does, and which way it is likely to be moving. Also think about what processes are occurring in each place.
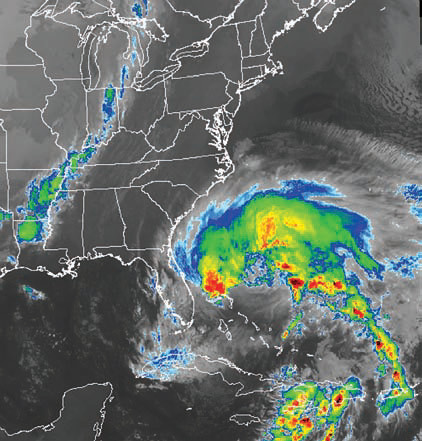
Sandy, still a hurricane at this time, is the large area of intense clouds and rainfall on the right side of the image. The storm has a coiled shape, reflecting rotation around cyclones due to the Coriolis effect. It is moving north, as many storms do in this part of the Atlantic. Note a second line of clouds and precipitation to the west on land. These clouds formed along a cold front, a boundary between cold air to the west and warm air to the east. Sandy is within the warm sector of the storm. On this image, the different shades of gray on either side of the front reflect the temperature contrast between the two air masses, colder (lighter gray) to the west and warmer (medium gray) to the east.
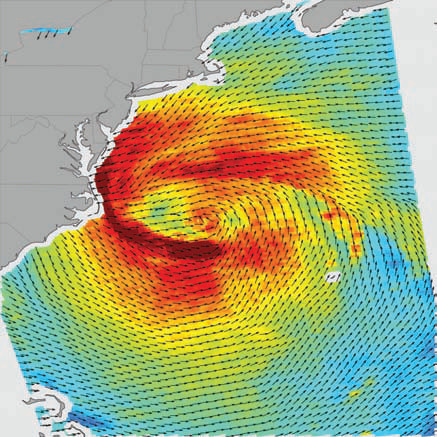
The image above shows wind speeds near the ocean surface as measured by radar on the Oceansat-2 satellite. Wind speeds above 65 km (40 miles) per hour are yellow, those above 80 kph (50 mph) are orange, and those above 95 kph (60 mph) are dark red. At the time shown in this image, strong winds along the western side were striking the Outer Banks of North Carolina, which is an especially vulnerable area for flooding due to storm surges associated with hurricanes.
Movement and Evolution of Hurricane Sandy
Hurricane Sandy originated in the tropics and then migrated northwest toward the North American continent before turning north and tracking along the East Coast. This sequence of three satellite images shows the evolution of Sandy with time, with the earliest image on the left and the latest image on the right. In the earliest image, Sandy is leaving the tropics as a somewhat dispersed, poorly organized storm. Note the curved cold front crossing the center of the U.S.
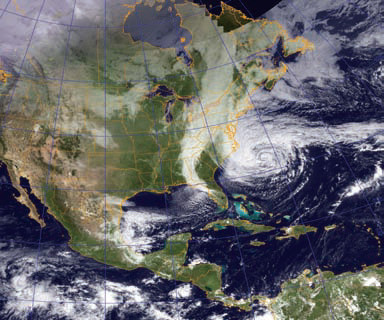
In this second image, Sandy has moved farther north, to a position off the Outer Banks. It has become more tightly coiled and better organized, which causes the hurricane to intensify and the destructive winds to speed up. As the hurricane and the midlatitude cyclone to the west get closer, they begin to interact. Note that the southern “tail” of the cold front is curving toward the east, as it gets drawn into the counterclockwise circulation around the hurricane.
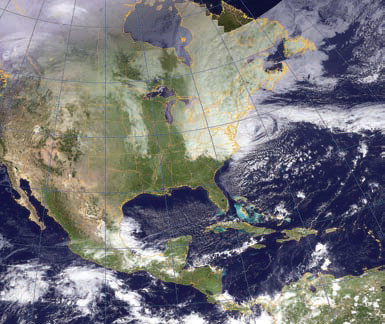
In this final image, Sandy and the cold front have collided, causing exceptional storminess across the Northeast. Many hurricanes turn northeast and head out to sea as they come up the coast, but Sandy turned northwest, directly into New Jersey. This unusual track was caused by an area of high pressure located over easternmost Canada, which blocked Sandy from moving northeast. The interaction between Sandy and the second storm made the situation much worse.
Hurricane Sandy
Hurricane Sandy began as a tropical disturbance in the Caribbean. The system strengthened considerably because it remained over very warm waters and was in a region with limited vertical wind shear. Sandy evolved into a named tropical storm and then a hurricane. The storm moved over Jamaica and Cuba, where it was weakened due to interactions with the land. It was downgraded to a tropical storm as it moved into the Atlantic. Once over open, warm waters of the Gulf Stream, it was reinvigorated, partly because of the approaching second storm to the west.
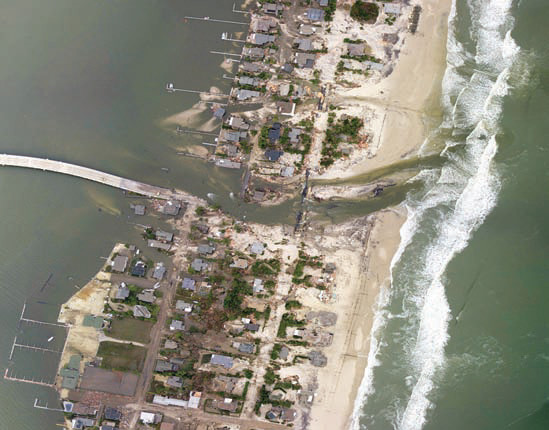
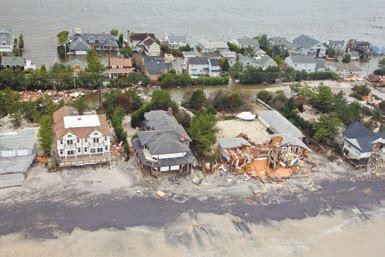
Several aspects of Sandy were very unusual, accounting for the excessive amount of damage. First, Sandy was a huge hurricane by any standards, affecting essentially the entire eastern half of the U.S. in one way or another, even though its wind speeds were not very strong by comparison to other hurricanes. A second factor was the way Sandy interacted with the mid-latitude cyclone to the west. Sandy formed fairly late in the hurricane season, and the front, with its accompanying very cold air, was fairly early for that type of winter storm. The interaction between the tropical-derived moisture and very cold air caused extremely heavy precipitation, including snow, ice, and blizzards, aspects we do not typically associate with hurricanes. Third, Sandy struck a part of the coast that does not experience frequent hurricanes, so some structures, especially those along the beach, were not built to withstand such storms.
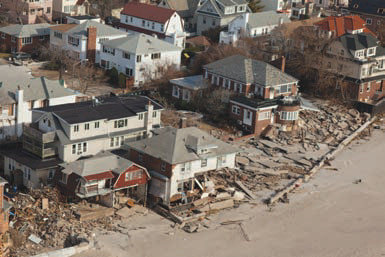
The three photographs included here represent a small sample of the destruction caused by Sandy. The large aerial image to the left shows damage to the Mantoloking area of New Jersey, including destruction of a highway and critical bridge, as well as severe damage to houses, especially those facing the ocean (on the right side of the aerial photograph). The two photographs below are from Coney Island, New York, and the coast of New Jersey. Consider what factors resulted in such severe damage to all three sites.