What Is Happening with the Ogallala Aquifer?
THE MOST IMPORTANT AQUIFER IN THE U.S. lies beneath the High Plains, stretching from South Dakota to Texas. It provides groundwater for about 30% of all cropland in the country, but it is severely threatened by overpumping. The setting, characteristics, groundwater flow, and water-use patterns of this aquifer connect many different aspects of water resources and illustrate their relationship to physical geography.
What Is the Setting of the Ogallala Aquifer?
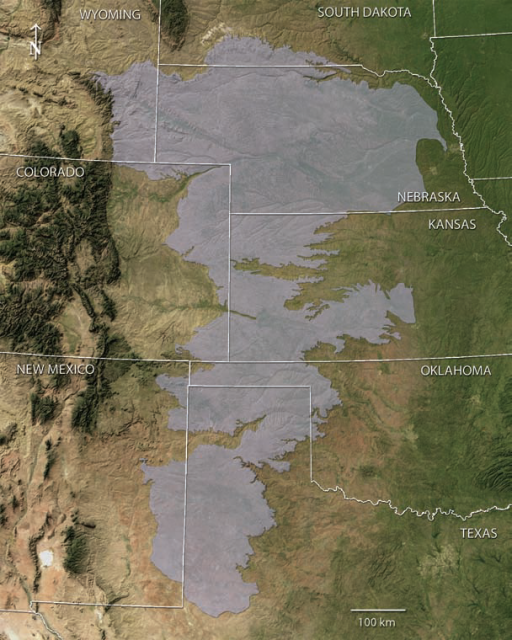
1. The Ogallala aquifer covers much of the High Plains area in the center of the U.S. The lightly shaded area on this map shows the outline of the main part of the aquifer. The aquifer forms an irregularly shaped northsouth belt from South Dakota and Wyoming through Nebraska, Colorado, Kansas, the panhandles of Oklahoma and Texas, and eastern New Mexico.
2. The Ogallala aquifer covers about 450,000 km2 (174,000 mi2) and is currently the largest source of groundwater in the country. It provides 30% of all groundwater used for irrigation in the U.S. In 1980, near the height of the aquifer’s use, 17.6 million acre-feet of water were withdrawn to irrigate 13 million acres of land. The water is used mostly for agriculture and rangeland. The main agricultural products include corn, wheat, soybeans, and feed for livestock.
3. The aquifer is named for the Ogallala Group, the main geologic formation in the aquifer. The formation was named in the early 1900s after the small Nebraskan town of Ogallala.
4. Much of the Ogallala Group consists of sand and other sediment (loose pieces of rock) carried by ancient streams and wind. The streams and wind spread the sediment over the landscape as a relatively continuous layer. This process ended when uplift and tilting of the Rocky Mountain region caused the streams to cut down into the landscape and carry the sediment farther east. Present-day streams continue to erode into the aquifer and drain eastward and southward, eventually flowing into the Gulf of Mexico.
The Aquifer in Cross Section
5. This vertically exaggerated cross section shows the thickness of the aquifer from west to east. It shows the aquifer in various colors; rocks below the aquifer are shaded bluishgray. Note that the aquifer is at the surface and is an unconfined aquifer.
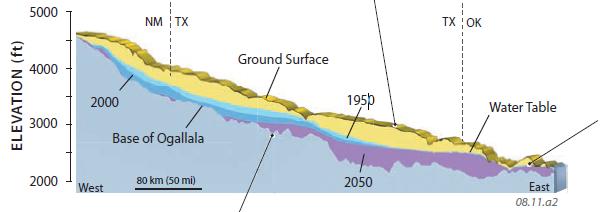
6. The irregular base of the aquifer indicates erosion of the land before deposition of the aquifer. 7. The upper part of the aquifer (shaded yellow) is above the water table and in the unsaturated zone.
8. Blue colors show levels of the water table for 1950 and 2000, and purple shows the predicted levels for 2050. Note that water levels in the aquifer have fallen due to overpumping. The western part is predicted to be totally depleted by 2050 (light purple).
Where Does Groundwater in the Aquifer Come from and How Is It Used?
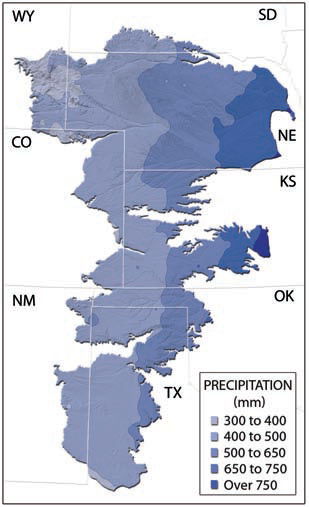
Most of the water accumulating in the aquifer is from local precipitation. This map shows the amount of precipitation received across the area, with darker shades indicating more precipitation. The western part of the aquifer receives much less precipitation (rain, snow, and hail) than the eastern part.
Areas of the aquifer that receive the least precipitation — the southwestern parts — are also those predicted to go dry by 2050.
This graph shows the water balance for the Ogallala aquifer. Water going into the aquifer is shown above the axis, whereas water being lost by the aquifer is below the axis. Some groundwater recharge occurs where water from precipitation seeps into the aquifer, especially in areas that receive higher amounts of precipitation, as either rain or snow.
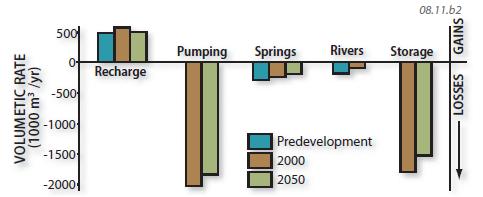
The amount taken out of the aquifer by pumping, springs, and inflow into streams greatly exceeds the recharge, so most parts of the aquifer are being dewatered.
As the aquifer dewaters it compacts, which causes a decrease in porosity and a loss of pore space (in which to store water).
This cannot be undone.
How Has Overpumping Affected Water Levels in the Ogallala Aquifer?
Hydrogeologists employed by the U.S. government estimate that the aquifer contains 3.2 billion acre-feet of water! That is enough to cover the entire lower 48 states with 1.7 feet of water. How much has overpumping affected the aquifer’s water levels, and what will happen to the region and to the country if large parts of the aquifer dry up?
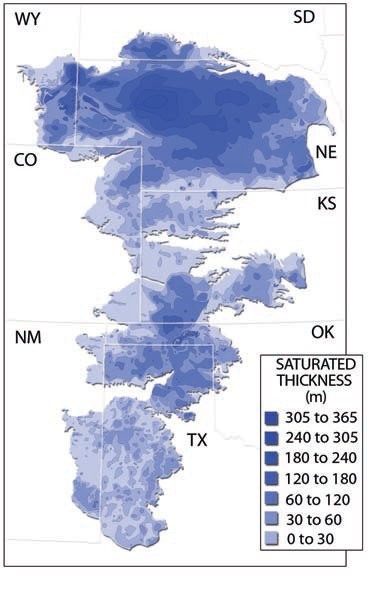
This map shows the thickness (in feet) of the saturated zone within the aquifer. In some of its northern parts, more than 300 m (1,000 ft) of the aquifer is saturated with water, whereas less than 60 m (200 ft) remain saturated in the southern parts.
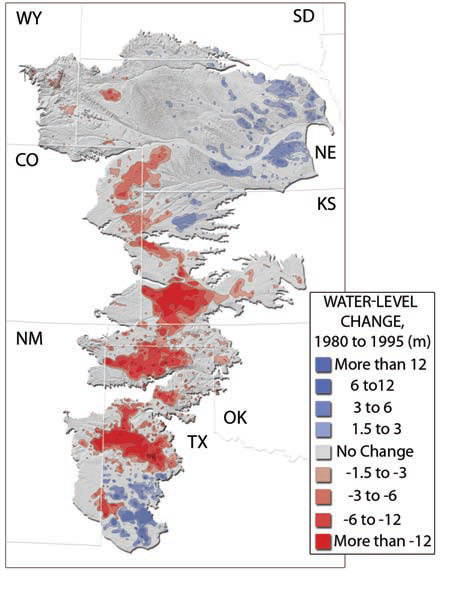
This map shows how many meters the water table dropped in elevation between 1980 and 1995 as a consequence of overpumping. The largest drops, exceeding 10 m, occurred in southwestern Kansas and the northern part of Texas. Compare this map to the one for precipitation.
Predictions — It is uncertain what will happen, but hydrologists are conducting detailed studies of key areas to try to predict what will happen in the next decades. Projections of current water use, combined with numerical models of the water balance suggest that some parts of the aquifer will go dry by 2050. This will have catastrophic consequences for the local farmers, ranchers, and businesses, and for people across the country who depend on the aquifer for much of their food. Subsidence related to groundwater withdrawal and compaction of the aquifer will be an increasing concern. What do you think will happen to the region if this aquifer is partly pumped dry?
- How Does Groundwater Contamination Move and How Do We Clean It Up?
- How Can Water Become Contaminated?
- What Problems Are Associated with Groundwater Pumping?
- What Is the Relationship Between Surface Water and Groundwater?
- How and Where Does Groundwater Flow?
- How Do We Use Freshwater Resources?
- How Do Water Balances Vary Spatially?
- How Do We Evaluate Water Balances?
- What Is the Global Water Budget?