What Is the Distribution of Precipitation?
THE AMOUNT OF PRECIPITATION varies from region to region, season to season, and day to day. The daily variations are related to short-term changes in weather, but variations between regions and seasons reflect differences in the overall climatic setting, such as differences in latitude, prevailing wind directions, proximity to large water bodies, any nearby ocean currents, elevation of the land, and countless other factors. We explore some of these by examining regional variations in precipitation over North America and the world.
How Does Precipitation Vary Across North America?
January
1. Examine this map, which shows average amounts of precipitation for January, averaged over several decades. In northern and high-elevation regions, much of this precipitation is as snow. Note any regional patterns and the precipitation that is typical for where you live.
2. Heavy rainfall along the coast of Canada and the Pacific Northwest is due to proximity to the ocean combined with orographic effects that cause moisture-laden Pacific air to move upslope under the influence of the mid-latitude westerlies.
3. Inland from the western mountains, precipitation totals decline dramatically. These areas are blocked from oceanic moisture sources by mountains both to the west and to the east.
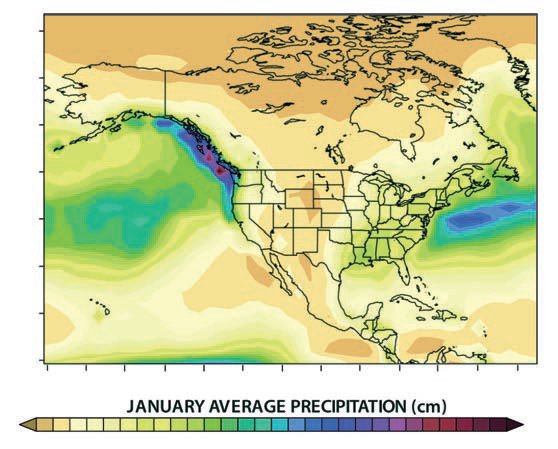
4. Precipitation decreases inland away from moisture sources and northward with lower temperatures. Cold air has lower water-vapor capacity and therefore will not produce clouds with a sufficient amount of moisture to allow for much precipitation.
5. The Great Lakes are much warmer than the overlying air in winter. This generates a steep environmental lapse rate, which makes an adiabatically moving air parcel likely to be warmer than its surrounding environment. Thus, the lakes destabilize the atmosphere, increasing local “lake effect snow” totals downwind.
6. Precipitation in both the Atlantic and Pacific oceans at this time of year is focused near the boundary between cold air and warm air, in part because these regions experience frequent passage of fronts.
July
7. This map shows precipitation totals for July, the middle of summer. Note the regional patterns and then compare this map with the one for January.
8. July totals are higher than in January in most of North America, except along the West Coast. In most areas, local surface heating destabilizes the atmosphere, but the cold California Current off the West Coast negates this effect.
9. Summer precipitation totals are low in western North America and over the adjacent Pacific Ocean, even in places that are relatively wet in winter. This is because of the drying effects of sinking air on the eastern side of the Hawaiian high-pressure feature, which makes its closest approach to North America in summer.
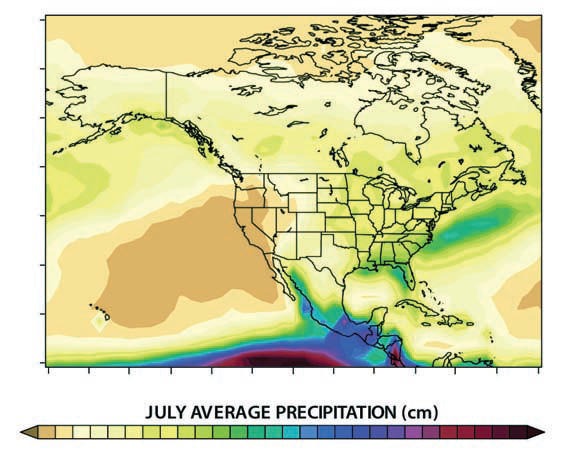
10. July totals are much higher than those in January in the far north. The warmer air has more energy to evaporate water, producing water vapor that can then precipitate. Also, the region is much closer to the cold-warm boundary in summer than in winter, facilitating frontal lifting.
11. The Great Lakes are cool relative to the overlying air in July. This weak environmental lapse rate (or even an inversion) stabilizes the atmosphere, the opposite of winter conditions, limiting the amount of precipitation.
12. In summer the Bermuda-Azores high-pressure area reaches its northernmost extent. The clockwise circulation around this feature supplies warm, moist air into interior North America.
13. The prong of higher precipitation that occurs in western Mexico is related to a northward flow of moisture as part of the “Arizona monsoon.” Near the mountains, intense surface heating and orographic lifting cause summer thunderstorms.
How Do Annual Precipitation Totals Vary Globally?
The map below shows average annual precipitation at a global scale. Examine the regional patterns and consider what factors might be causing them. You may want to refer back to the globes showing specific humidity earlier in this chapter. An area that most people consider to be “wet” generally has high precipitation and high humidity. How dry an area seems is a function of low precipitation, low humidity, and evaporation rates that exceed precipitation rates.
1. Globally, precipitation is concentrated in equatorial oceanic areas, expressed as a belt of blue and green colors near the equator. Precipitation generally decreases poleward, inland, and downwind from major mountain ranges.
2. The tropical rain forests of Indonesia, along with adjacent parts of the Indian and Pacific oceans, are among the wettest places on Earth. They are part of an east-west belt of high precipitation that roughly follows the intertropical convergence zone (ITCZ). Along the ITCZ, convergence of moisture-laden air carried by the northeast and southeast trade winds causes lifting and precipitation. The Hadley cell migrates with the seasons, so the position and influence of the ITCZ do, too.
3. Locations in the subtropics (30° N and S) tend to be very dry. This belt of latitudes contains many of the world's deserts, such as the Sahara and those of the Arabian Peninsula, southwest Africa, central Australia, and the American Southwest. Even though warm air would ordinarily tend to rise in these warm areas, this effect is counteracted by descending air in the downward-directed part of the Hadley cells. Some of these areas are especially dry because they are in the rain shadow of major mountain ranges. Exceptions to the dry subtropics occur along the east coast of continents (for example China), where there is an abundance of warm, moist air in association with warm surface ocean currents that flows around subtropical anticyclones.
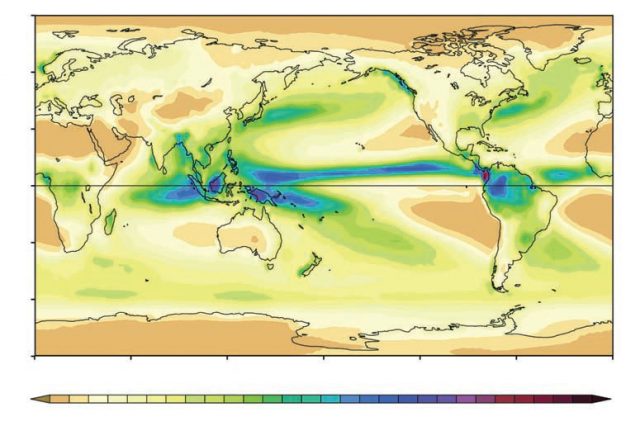
4. Polar areas are generally too cold to have much water in the atmosphere. Limited moisture, combined with the sinking of the intense cold air, opposes vertical cloud development. Furthermore, these areas are typically far from boundaries between warm and cold air, which can produce warm and cold fronts and their attendant storms. As a result, places near the poles receive very little precipitation.
5. Relatively little was known about precipitation over the oceans until recent years when satellite data became available. Oceanic patterns are similar to continental ones, except for the absence of complications caused by topography.
6. The Amazon basin, with extensive tropical rain forests, is another region of high precipitation. This is due to the ITCZ and to orographic lifting of the moisture-laden trade winds over the eastern flanks of the Andes Mountains.
7. The east coasts of mid-latitude continents are generally moderately wet, as cold and warm air meet frequently, producing frontal precipitation. In summer, convective precipitation supplements the totals.
8. The idea that Siberia receives extremely large amounts of snowfall is a myth. The intense Siberian High is driven by cold, dense air, and it produces a sinking motion. The cold surface also acts to decrease the environmental lapse rate, making it more likely that an adiabatically moving air parcel will remain colder than its surrounding environment, enhancing atmospheric stability.
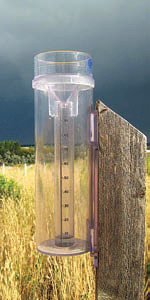
How We Measure Precipitation
Rainfall is measured using a standard cylinder with a circumference that is 1/10 of the opening. The amount of rainfall can be read from graduated markings on the cylinder or from a measuring stick with hashmarks exaggerated 10 times. This allows for the observation of rainfall totals to the hundredths of an inch. Some rain gauges, like the one shown here, contain two cylinders, one for measuring typical rainfall amounts and a second larger cylinder used when extreme amounts of precipitation cause the first cylinder to overflow. When it snows, the snow is allowed to melt and the amount of liquid can be measured as described above. Snow typically has an average density of 8% that of water, so the equivalent of one centimeter of rain will produce, on average, more than 12 cm of snow (an inch of rainfall will produce a foot of snow), but this ratio can vary widely, depending on local conditions.