World Patterns of Air Temperature
We have learned some important principles about air temperatures in this chapter. Surface type (urban or rural), elevation, latitude, daily and annual insolation cycles, and location (maritime or continental) can all influence air temperatures.
Now let's put all these together and see how they affect world air temperature patterns. First, we need a quick explanation of air temperature maps. Figure 3.21 shows a set of isotherms—lines connecting locations that have the same temperature. Usually, we choose isotherms that are separated by 5 or 10 degrees, but they can be drawn at any convenient temperature interval.
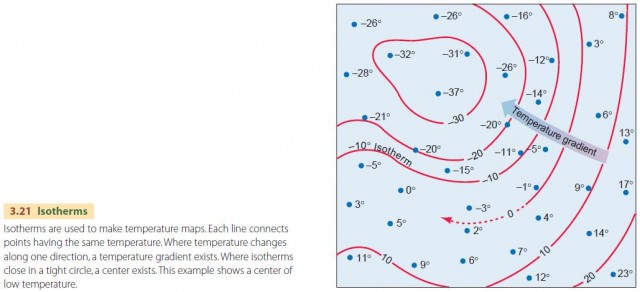
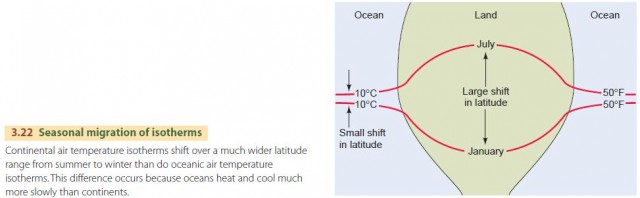
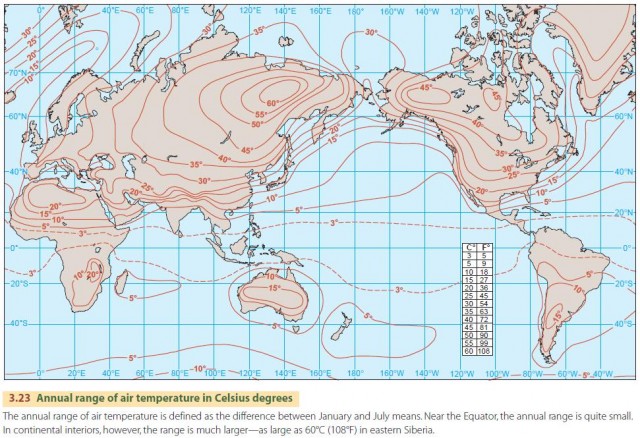
Isothermal maps clearly show centers of high or low temperatures. They also illustrate the directions along which temperature changes, which are known as temperature gradients. In the winter, isotherms dip equatorward while in the summer, they arch poleward (Figure 3.22). Figure 3.23 provides a map of the annual range of temperature, which is greatest in northern latitudes between 60 and 70 degrees.
FACTORS CONTROLLING AIR TEMPERATURE PATTERNS
We have already met the three main factors that explain world isotherm patterns. The first is latitude. As latitude increases, average annual insolation decreases, and so temperatures decrease as well, making the poles colder than the Equator. Latitude also affects seasonal temperature variation. For example, the poles receive more solar energy at the summer solstice than the Equator. So we must remember to note the time of year and the latitude when looking at temperature maps.
The second factor is the maritime-continental contrast. As we've noted, coastal stations have more uniform temperatures, and are cooler in summer and warmer in winter. Interior stations, on the other hand, have much larger annual temperature variations. Ocean currents can also have an effect because they can keep coastal waters warmer or cooler than you might expect. Elevation is the third important factor. At higher elevations, temperatures will be cooler, so we expect to see lower temperatures near mountain ranges.
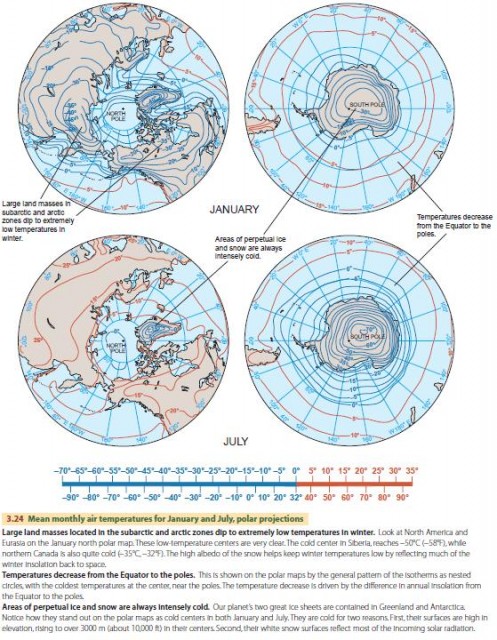
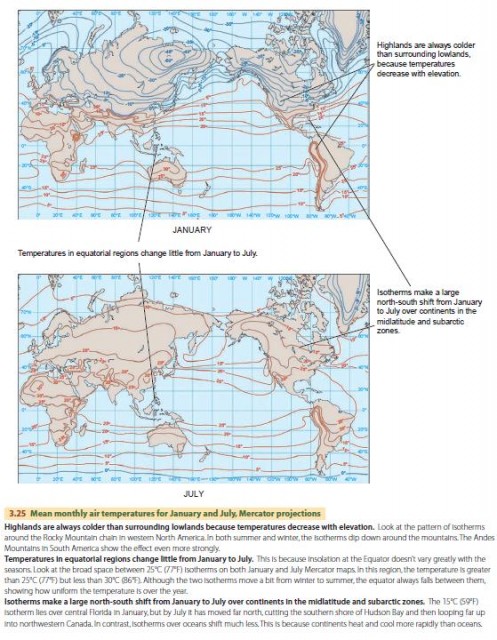
WORLD AIR TEMPERATURE PATTERNS FOR JANUARY AND JULY
World air temperatures for the months of January and July are shown in Figures 3.24 and 3.25. The polar maps (Figure 3.24) show higher latitudes well, while the Mercator maps (Figure 3.25) are best for illustrating trends from the Equator to the midlatitude zones. Using the principles of how air temperatures are related to latitude, maritime-continental contrast, and elevation, it is easy to explain the six important features that are described in the figures.