What Causes Changes in Insolation?
THE ENERGY TRANSMITTED from the Sun to Earth, called incoming solar radiation, or insolation, has varied only slightly during the short time for which we have accurate measurements from satellites. How much energy do we receive from the Sun, and why does it vary at all?
How Much Energy Is Transferred from the Sun to the Earth?
1. To help us envision how much energy Earth receives, imagine a thin circular disc that is the same diameter as Earth, making it just large enough to intercept all energy that would fall on Earth's more complex, spherical shape.
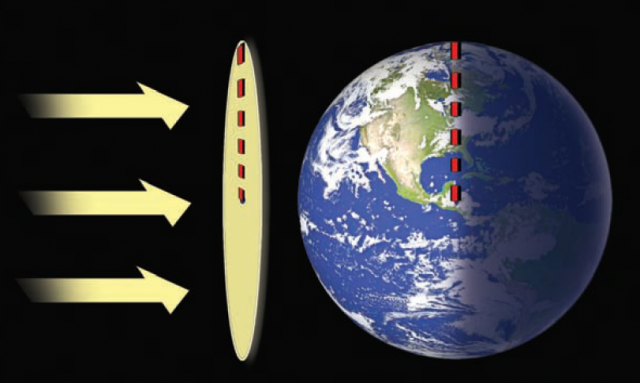
2. According to both measurements and calculations, a relatively consistent amount of energy is radiated on this disc every second. This relatively consistent amount of energy — equivalent to 1,366 watts per square meter (W/m2) — is called the solar constant. This equates to only about one two-billionth of the power emitted from the Sun, since the Sun's energy goes out in all directions, not just toward Earth. Each planet would have a different solar constant due to differences in their distance from the Sun, with planets farther from the Sun receiving much less energy.
3. However, each place on Earth's surface does not get 1,366 W/m2 of power from the Sun all the time. Any place experiencing night receives zero, whereas equatorial locations experiencing clear skies during the summer may get 600 – 700 W/m2 at noon. Something happens to the rest of the insolation between the time it reaches the atmosphere and the time it reaches the surface.
4. During the course of a day, this amount of energy is spread out over the entire surface area of the planet and its atmosphere. A sphere has four times more surface area than a circle of the same radius, so the energy must be spread out across four times more area for the sphere compared to the disc. Dividing 1,366 W/m2 by four yields 341.5 W/m2. Geographers and solar scientists actually use 345 W/m2 (slightly more than ? of 1,366) for the average insolation to the top of the atmosphere because Earth is not exactly a sphere.
How Does the Amount of Insolation Change During a Year?
The amount of insolation varies during the year because the Earth is closer to the Sun at certain times of the year , but not the times you would expect — Earth is closer to the Sun during the Northern Hemisphere winter.
1. Although the average Earth-Sun distance is 150 million km, Earth's orbit is slightly elliptical rather than circular. The orbit is so nearly circular that it is virtually impossible to notice the elliptical shape in an accurately drawn view looking perpendicular to the orbital plane. However, Earth is slightly closer to the Sun at some times of year than others, with the Earth-Sun distance varying about 3% during the course of the year.
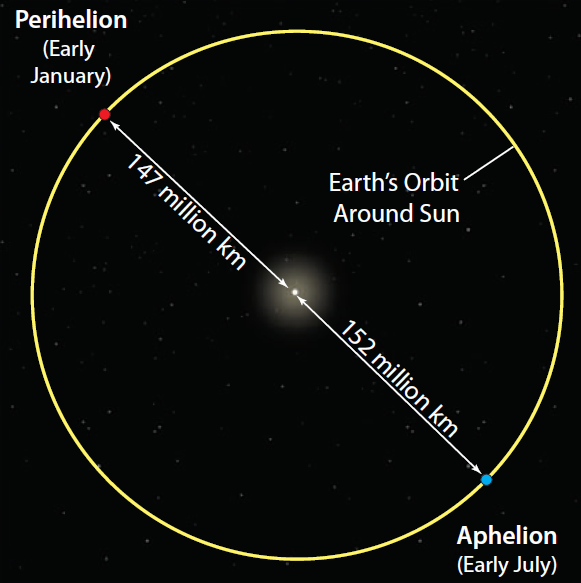
2. The date of closest approach is called the perihelion, where “peri” is a Greek word for “around” and “helio” refers to the Sun. Perihelion currently occurs in early January, but the exact date varies a bit each year, and moves forward by one day each 65 years. Over several hundred thousand years it may change season completely, causing changes in our climate.
3. The date of farthest approach is the aphelion, where “apo” comes from a Greek word meaning “from.” The aphelion is, perversely for Northern Hemisphere dwellers, early in July. In other words, we are farthest from the Sun during our summer — the seasons cannot be explained by our changing distance from the Sun. As with perihelion, the actual date of aphelion varies slightly from year to year. For now and the immediate future, it occurs in early July.
4. This variation in Earth-Sun distance, from perihelion to aphelion and back again, constantly changes the average amount of insolation Earth's atmosphere receives. When the Earth is closest to the Sun (during the Northern Hemisphere winter) it intercepts more of the insolation. Changes in the amount of insolation striking the Earth on any given day can be calculated knowing the solar constant and the Earth-Sun distance on that day. From these calculations, the amount of energy is greatest at perihelion, decreases for half the year as Earth approaches aphelion, and then increases the next half of the year on the way to perihelion. The total amount of variation in energy related to Sun-Earth distance is about 7%.
Does the Sun's Output of Energy Change Over Years, Decades, and Centuries?
Like most natural systems, the Sun's activity varies, sometimes increasing and other times decreasing. The Sun exhibits cycles that repeat over the course of a decade or so, and it has longer fluctuations that occur over multiple decades. These cycles influence the Sun's total output of energy, called the total solar irradiance (or simply TSI).
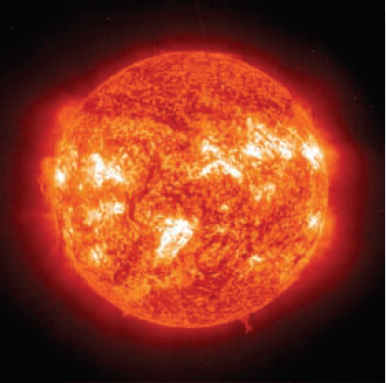
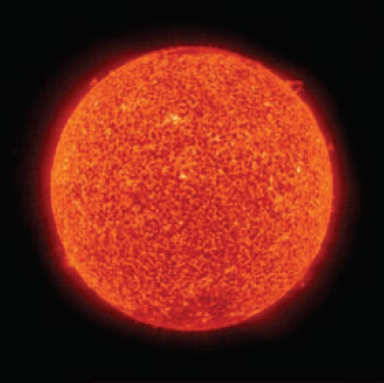
1. This top pair of images shows the Sun at two different times, approximately 9 years apart. In the left image, the Sun has a number of dark spots, termed sunspots. These are places that are slightly cooler than the rest of the Sun, and so show up darker. In the image to the right, the Sun lacks any sunspots. The number of sunspots varies from year to year.
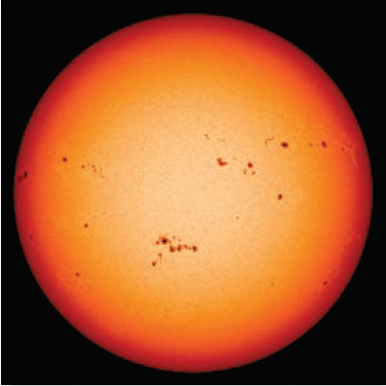
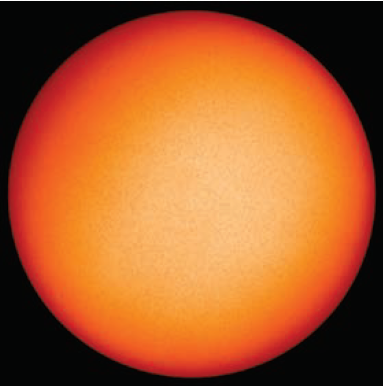
2. This second pair of images shows the Sun at the same two times as in the top images, but displays emissions at ultraviolet wavelengths, rather than visible light. They indicate that the Sun is much more active and emitting more overall energy when there are more sunspots. So more sunspots means more energy output from the Sun. Data collected by satellites since 1978 show small (<1%) monthly changes in the output of solar energy and a correlation between sunspot activity and TSI.
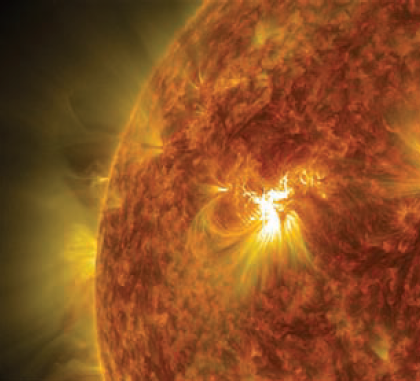
3. Another expression of the Sun's activity are bursts of intense energy and matter directed into space, termed solar flares. The bright regions producing solar flares in the image above are so large they could contain the Earth many times over. Solar flares pose a hazard to people and equipment in space and can affect wireless communications on Earth.
4. Scientists have been observing and counting the number of sunspots over time, calculating the average number present at any time, a value called the sunspot number. This graph plots monthly averages of sunspot number as a function of time since 1950. From the data, there is an approximately 11-year cycle of sunspot activity, where the number of sunspots starts out at some minimum number and then increases to a maximum number and then decreases again. This full cycle from minimum to maximum and back to minimum is called a solar cycle (or sunspot cycle). Solar cycles are numbered sequentially from the 1700s (the first accurate sunspot data) to the present — we are currently in solar cycle 24.
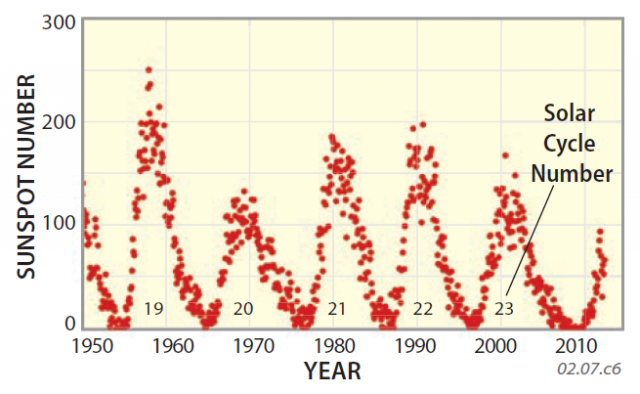
5. As you can observe from this graph, the maximum number of sunspots (the heights of the “peaks” on this graph) varies from cycle to cycle. The higher the sunspot number, the more active the Sun. The duration of a cycle can also be more than or less than 11 years. The length of a cycle can help solar scientists predict the maximum sunspot number, and therefore solar activity, for the next cycle.
6. Sunspots have been counted for several centuries, revealing some important patterns. This plot shows sunspot observations from the 1600s. The data are much more accurate for recent times, compared to the early observations, but the broad patterns shown are accepted by most scientists. Red points are early, less accurate measurements, blue data are more recent, and the black line is a smoothed average.
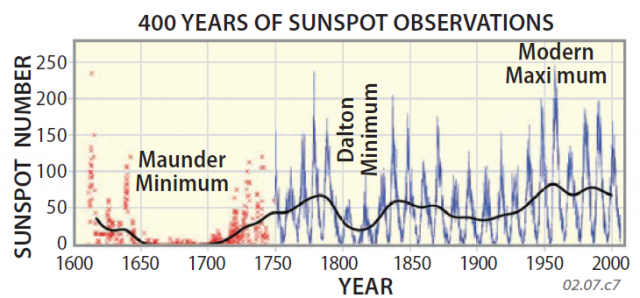
7. There have been several times, such as the Maunder Minimum, when there were few or no sunspots for many years in a row. The Maunder Minimum occurred during one of the coldest periods in the last 1,000 years, a time called the Little Ice Age. In contrast, our modern warming has occurred during a time of very high solar activity, as recorded by numerous sunspots.