Biodiversity Mapping: History
The mapping of species distributions has a long history in geography. As far back as the early 1800s, Alexander von Humboldt described the latitudinal and altitudinal distributions of vegetation zones, and others continued such practices until methods were eventually formalized within the subdiscipline of biogeography. In other disciplines, too, particularly biology, the notion that place matters in ecological processes and patterns was reinforced, perhaps most famously by Macarthur and Wilson in their 1967, Theory of Island Biogeography. More recently, in the face of rapid biodiversity loss, attention has been increasingly focused on the application of these ideas to the challenge of trying to protect biodiversity.
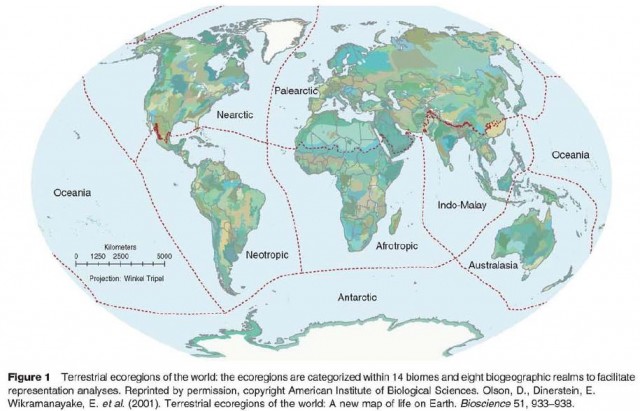
Modern biodiversity mapping began in the 1970s when several researchers began to devise schemes to divide the landscape into functional units of significance for conservation and/or resource development. It was hoped that these new ecological land classification systems would provide policymakers with boundaries that would be more suited to making resource management decisions than are political boundaries. For example, ecologist Raymond Dasmann identified approximately 200 biotic provinces worldwide, while biologist Miklos Udvardy devised a global scheme with a similar number of biogeographical units; at about the same time Robert Bailey of the US Forest Service created maps of the ecoregions of North America. Such schemes have since been further refined, with more focused and nuanced regional analyses as well as efforts to improve global approaches. One of the most extensive efforts in this respect lias been the World Wildlife Fund's ecoregion project, which has now developed a comprehensive global classification system of ecoregions specifically for the purposes of conservation (Figure I).
More recently, conservation activities have moved away from emphasis on the protection of individual spe cies toward approaches that explicitly recognize the role of ecosystems and regional- or landscape-level processes. 'Phis has stimulated an interest in examining spatial patterns of biodiversity, which have become pivotal in developing new conservation strategies. The concept of gap analysis, originally developed by J. Michael Scott, was critical in this context. First used in the 1980s in Hawaii, this technique relies on overlaying maps of the distributions of different species with maps of protected areas in order to identify gaps in protection. The technique has subsequently been practiced elsewhere in the US, and is now promoted by several federal and state agencies. Ir has also been used in other countries, including Australia, Costa Rica, and Italy. Gap analysis remains one of the most common applications of biodiversity mapping.
Spurred on by technological innovations, particularly in the realms of CIS and remote sensing, the techniques of biodiversity mapping developed rapidly in the 1980s and 1990s, as many of the theoretical underpinnings of the idea were refined. The ability to easily overlay multiple layers of information in a GIS has proved critical to incorporating the large amounts of information required for an effective analysis. Today, biodiversity mapping is being widely implemented, and is supported by a large body of literature that has emerged particularly over the last 10 years. Most major conservation organizations currently use biodiversity mapping ro some extent, including Conservation International, The Nature Conservancy, and the World Wildlife Fund, as well as many intergovernmental and governmental organizations, such as the United Nations Environment Program (UNEP), and the United States Geological Survey and Forest Service.
A dramatic increase has been seen in the area protected for conservation between 1970 and 2000, with an approximately tenfold expansion in areal coverage globally. Further expansion of protected areas is predicted and biodiversity mapping will likely continue to play an important role in assessing conservation priorities. Increasingly, it may also play an important role in monitoring efforts as biodiversity mapping procedures become simpler and cheaper and the rime span over which they have been applied grows.
Types of Biodiversity Mapping
Biodiversity mapping has evolved into a variety of forms since its inception, reflecting different approaches to measuring biodiversity. As already noted, biodiversity is notoriously difficult to measure or estimate. A particular challenge is that biodiversity is hierarchical, with meaning at a variety of scales from the molecular to the ecosystem and even global level. Maintaining biodiversity at all scales is a primary goal of conservation planners, and yet how this can be achieved is highly controversial. Should biodiversity be assessed at the cellular, species, or landscape level; and will striving for maximum biodiversity at one scale necessarily correlate with the protection of maximum biodiversity at other scales? Many reports suggest not, and so the scale at which biodiversity mapping takes place becomes a critical decision for the mapmaker.
Related to the challenges posed by scale, it is impossible to address effectively all elements of biodiversity in any single map. For reasons of feasibility and cost, surrogate (or proxy) measures of biodiversity must usually be employed as indicators of a region's overall biodiversity. A variety of different surrogate measures have been suggested and implemented in different schemes, including (1) species richness using an indicator group, (2) richness of higher taxa, and (3) landscape level environmental proxies.
The traditional approach has been to measure the species richness of a particular indicator group and then use this as an estimate of regional biodiversity; for obvious reasons the indicator group selected is usually one that can be readily inventoried, such as birds or amphibians. Although this technique is relatively easy to implement and can sometimes make use of the large volume of data that already exists on species distributions, it has been widely criticized for failing to provide sufficient evidence that species richness in one group necessarily correlates to species richness in other groups. For instance, the fact that a particular area of forest has a large variety of amphibian species does not necessarily mean that that same area is also host to diverse plant or invertebrate communities.
A second approach is to analyze higher taxa, such as genera or families. It is argued that simple number of species is not as relevant to preserving biodiversity as is taxonomic uniqueness. In this context, for instance, the two species of the rare tuatara (a reptile found in New Zealand), which represent the last remaining species of an entire taxonomic family, could be considered a more important conservation target than a large number of mouse species, each of which is taxonomically very similar. Along similar lines, endemic species are often considered especially valuable for protection as they are unique facets of the biodiversity of a particular region.
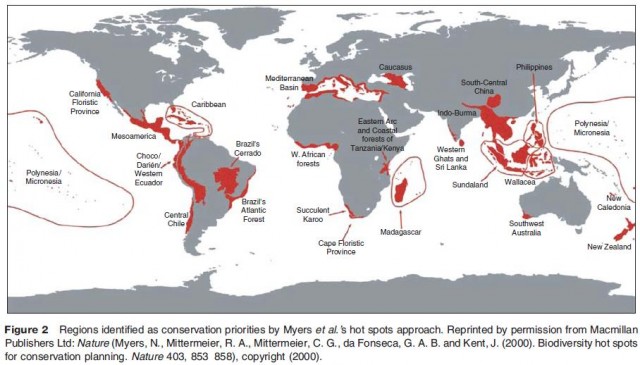
These first two approaches are often used to provide the information required for a hot spot analysis (Figure 2). This approach, devised by environmental scientist Norman Myers in the late 1980s, calls for the protection of hot spots of biodiversity, initially assessed by simple species counts, on the understanding that targeting these areas for protection would save the largest number of species at the lowest cost. As a result, hot spot analysis is sometimes referred to as a form of conservation triage. While the approach has received considerable attention and support, critics have pointed to the fact that it tends to focus attention on tropical areas at the expense of other less biodiverse but equally important regions, and that much of the biodiversity in a particular region may be taxonomically very similar. In response to such criticisms, many more recent hot spot analyses by Myers and others have incorporated notions of taxonomic richness and endemicity in addition to simple number of species in the selection of priority areas. In 1996, Conservation International engaged this more complex notion of hot spots, adding the idea of vulnerability of sites to the selection procedure in an effort to develop a more nuanced reading of the notion of hot spots.
The third approach to biodiversity mapping is to consider landscape level environmental characteristics as proxies for biodiversity. This may be done using particular environmental characteristics such as rainfall and temperature, but is most commonly accomplished using remotely sensed maps of vegetation coverage. Vegetation data are used to strive for the representation of as many different ecosystems as possible in an array of reserves. This representation approach contrasts the hot spot approach. While both approaches share the goal of protecting maximum biodiversity, proponents of the representation approach argue that this can be done most effectively by protecting portions of as wide a variety of different ecosystems as possible, rather than focusing on just those with the most species. In this way, it is hoped that broader goals of taxonomic uniqueness will be captured as well as high species counts. Opponents argue that representativeness approaches are less politically viable than hot spot approaches because they dilute conservation targets over an unfeasibly large number of sites. Furthermore, taken to its ultimate conclusion, a representativeness approach could be used to imply that a large number of small protected areas are more valuable than several large ones, contradicting many ecological studies which suggest that small reserves are particularly prone to species loss and damage from stochastic events. Most practitioners accept this limitation and do not take the technique to such an extreme.
The idea of representativeness is also an important component of gap analysis. In a gap analysis, information about different species' ranges and the current array of protected areas in the region are entered into a GIS. With appropriate processing, maps are then produced that can highlight species and communities that are not adequately protected – where there are 'gaps' in the reserve system. Here, the graphic representation of the map is critical to highlighting meaningful patterns from large quantities of spatial data. Critics of gap analysis point to the difficulty of producing meaningful results from multiple sources of data of questionable quality. Proponents argue that it is reasonable to use available data with appropriate precautions (such as ground truthing), even if the resulting maps are not perfect.
Although these techniques use diverse theoretical approaches, considerable effort has recently been made to try to combine some of these approaches to achieve the best of all worlds. The World Wildlife Fund's Global 200 program is one example of such a combination approach. The Global 200 identifies 238 target regions for conservation in order to try to achieve coverage of as many different ecosystems as possible (a representativeness approach). In addition, the areas selected are judged according to rareness of habitat type worldwide, total number of species present, number of endemic species, presence of higher taxa, and unusual ecological or evolutionary phenomena, thereby also incorporating aspects of a hot spot approach.
Biodiversity mapping elicits considerable controversy over the best techniques for creating meaningful maps. While detailed information on species distributions and ecosystem patterns would be ideal for making conservation decisions, this information is rarely available. To a large degree, biodiversity mapping projects must therefore not only rely on proxies for estimating biodiversity, but must also be mindful of the potential pitfalls of these approaches and strive to minimize error. Many techniques have been suggested for addressing these limitations. Some efforts focus on ensuring that data are as accurate as possible, as with ground truthing remotely sensed data. Others attempt to refine the decision making processes through the use of algorithms. Some of these key challenges within biodiversity mapping are discussed below.