electoral geography
ELECTORAL GEOGRAPHY is a part of POLITICAL GEOGRAPHY. It is the geographical study of political space in democratic states. Electoral research in dictatorships can be useful although, their citizens are not really freely choosing. Electoral geography is therefore a special study of electoral processes and districts to map election results and then to test the results for the causes. Electoral geography as the study of election districts and the voting behavior in them has been of interest to politicians, political scientists, geographers and others since the rise of democracies in place of other forms of government in the last several centuries.
In England before the American Revolution and in the UNITED STATES since the adoption of its present constitution the practical politicians who have had the power to shape legislative districts have found that the boundaries of districts can be drawn to favor one political party over another. The American term for this is gerrymandering. The term was first applied to election districts drawn in the late 1700s in MASSACHUSETTS by the Federalist Party. At the time Elbridge Gerry was the governor. One of the districts looked like a salamander; however, a political wit punned the district from a salamander into a “Gerrymander.”
In England, concern with “rotten boroughs” was a concern with electoral geography and the malapportionment of the size of the districts. Ultimately, the lack of equal representativeness in districts is a concern with the legitimacy of a political system. Democratic regimes are based upon the principle of the equality of the “voters” or the people who are citizens and thus have the right to make political decisions. This means that political sovereignty of the people in elections is entailed in the shape and the demographic contents of each district. When districts are drawn by legislatures or other decision-making bodies to increase the power of one group over another, the resulting legislative or other districts become inherently unjust.
In America, the courts and ultimately the Supreme Court of the United States has tolerated political gerrymandering, but it has ruled as unconstitutional racial gerrymandering. Cases such as Gomillian v. Lightfoot (364 U.S. 339) (1960) or the cases of Shaw v. Reno (509 U. S. 630) (1993) and Miller v. Johnson (515 U.S. 900) (1995), in NORTH CAROLINA and GEORGIA respectively, have dealt with the subject. The Gomillian case considered racial gerrymandering in Tuskegee, ALABAMA. Ordered to allow African Americans to vote and aware that whites were greatly outnumbered, the city government gerrymandered the city's territory from a square to a contorted figure that excluded all but about seven or eight nonwhite voters. The Supreme Court in this case was dealing with electoral geography, as it was in the recent cases of Shaw and Miller, where the Department of Justice had ordered southern states to draw some districts with African American majorities. Again the court had to rule on an issue of racial gerrymandering.
There are several ways in which gerrymandered districts are drawn. In the first approach, the goal is to populate each district with a 51 percent majority for the party in power and 49 percent district vote for the minority party. Another approach is to locate as much of the minority party's voting strength into a few “super” districts that will be carried by huge majorities approaching 99 percent. The effect is that the minority party carries a few districts but loses all the rest and thus has a much smaller legislative representation than it would have if the election districts were drawn in a way that spread the votes of the major parties in a more competitive manner. A third approach is a combination of the first two approaches. The party doing the gerrymandering can push significant numbers of minority party voters into a few districts and then spread the rest into districts where the minority party is always outvoted. This method allows the majority party to carry a large number of seats in the legislature or parliament.
Electoral geographers study votes of plebiscites. These are often votes for constitutional amendments or some form of referendum. Studies of plebiscites focus on the spatial elements associated with the vote in order to explain why people in one area voted differently from those in another area.
Electoral geographers also study the votes of deliberative assemblies such as legislatures or parliaments. The electoral geographer then seeks to move beyond the pattern of votes cast in elections or plebiscites. The focus of these types of studies is to explain blocs of votes or to determine whether the votes are in the “best interests” of the people being represented. Studies of votes in the United Nations and other legislative bodies can verify bloc voting. The challenge for the electoral geographer is then to interpret the descriptive results in order to explain why votes were cast as they were.
Analysis of votes of deliberative bodies is risky because the motivations for voting may be hidden in a veil of diplomacy or motives in an hidden agenda. Electoral geographers then have to move beyond the description of the votes to reveal the real causes of the voting patterns.
It should be noted that elections are conducted according to rules. These rules may be used to create the illusion of fairness in an election. Or they may be used to slant the results for the benefit of one group over another. Electoral geographers can reveal these types of machinations, but at the same time, of the approximately 200 states in the world today, less than half are democratic enough for analysis of their votes by the techniques used by electoral geographers to be meaningful.
ELECTIONS AND MAPS
Political geographers specializing in electoral geography began to study the field as early as 1916, when E. Krebheil published a paper examining British parliamentary elections. Sixteen years later, J.K. Wright published a series of maps of the presidential elections in the United States between 1876 and 1928. In addition, he presented an introductory analysis of the maps to show the influence of northern Republican Party states and southern Democratic Party states in terms of types of farming areas and ethnic minorities.
After World War II, there was a decline in interest in political geography; however, at the same time interest in electoral geography increased. A number of studies, such as those issued by V.K. Dean in 1949 on voting in Newfoundland, stimulated an interest in the subject. Other studies were produced, such as the pioneer study in electoral geography published in 1959 by J.R.V. Prescott. In his study, “The Functions and Methods of Electoral Geography,” Prescott pointed out to geographers that election statistics were of value to the discipline, but just a few such studies had been done. Prescott, an Englishman, also noted that some Europeans, especially the French, and also American political scientists were engaged in the subject.
The study of electoral geography by political geographers developed new interests in the mid-20th century with the advent of the “behavioral movement.” The behavioral movement developed from the research and writing of experimental psychologists like John B. Watson and B.F. Skinner. Watson, influenced by the studies of Ivan Pavlov, rejected the study of mental operations because these could not be observed in a public manner by a scientific observer. For Watson and other behaviorists, the mind was rejected as a private matter. Instead only publicly observable data was to be admitted as matter for scientific consideration. Skinner's experiments developed into theories on conditioning. Social scientists found that these studies were useful for studying voting behavior. For political geographers, the spatially concentrated voting data became a subject of study.
Criticism of the influence of behaviorism launched the post-behavioral movement in political science and elsewhere during the Vietnam War when opponents of the war found that empiricism did not provide grounds for opposing the war. Their criticisms were basically of two types.
First, allegedly, the studies it generated were value free and products of strict empiricism. However, critics argued that the movement described but did not prescribe when it should have. Numerous empirical studies produced data, mapped results of the analysis of elections, demonstrated the geographic distribution of different kinds of laws in the United States, and ultimately seemed to document the obvious. However, empirical data is gathered on the basis of some theory. Otherwise the researcher will not have a direction for the research project or a theory of knowledge for its analysis and integration into a science as an objective body of knowledge.
Moreover, criticism of strict empiricism observed that ultimately electoral geography was a study of values. The study of inequities in election districts or the study of the distribution of votes was ultimately a study of liberal democracies (e.g., the United States) and social democracies (e.g., SWEDEN). Modern governments are prescriptive in nature because they organize power, make decisions about who should rule, and decide who gets what, when, and how on the basis of the values of their underlying theories of human nature, of justice, of liberty, and other social values.
With data from actual elections (voting data) and statistical research on voters in areas from public opinion polling and other similar studies, political geographers could ask questions pertinent to electoral geography. They would include questions such as, Is it possible to predict political responses, given certain stimuli? How are political decisions made? What leads people to vote as they do? Can any political lessons be learned from this?
After 1960 studies in electoral geography grew more rapidly as attention was paid to spatial patterns of voting behavior in an attempt to determine underlying factors influencing voters. Other studies developed a variety of quantitative techniques for analyzing voting results. These techniques included multiple regression analysis in combination with maps, factor analysis, and correlation techniques.
NEW ELECTORAL GEOGRAPHERS
In 1969, D.R. Reynolds and J.C. Archer tested patterns of party support in the 1967 mayoral election in Indianapolis, Indiana. They represented a new breed of electoral geographers seeking to test for spatial processes such as contagion and contextual influences. The used a complicated mathematical analysis of the vote to test for correspondence with a normal distribution. They then examined the distribution for its spatially significant deviations from randomness. They then analyzed the distribution for explanatory components and then tested them for normality and contiguity. They then applied further mathematical analysis to show that variations in the vote were explained in terms such as socioeconomic class and race.
In 1970, T.G. Glanville published his study of “spatial biases” in the votes after a federal election in the Australian state of Victoria. His study revealed two types of spatial biases. Both of the spatial biases were patterns of gerrymandering that caused the opposition to “waste” their votes.
Another aspect of electoral geography is the role of money. Elections determine who gets to control governmental spending. Studies in the late 1970s by R.J. Johnston documented how political parties in Great Britain and the United States used money to encourage political support. In his study of British elections, he documented the success of the Labour Party in the bielections of 1977. The success was preceded by raising the status of the marginally loyal district of Grimsby to Development Area status. The change meant more financial aid from the government for the area and seems to have been translated into votes. Johnston also studied the use of “pork barrel projects” to curry favor with voters in some districts. The term pork barrel project is a synonym in American politics for unnecessary and wasteful government spending for political purposes. The image is of a wooden barrel filled with salt pork (fat back) being distributed to slaves at special events in early American history. The projects that Johnston studied were distributed money by politicians who were on Congressional committees exercising oversight of the National Aeronautics and Space Administration, the Atomic Energy Commission and the Defense Department.
Since the 1980s studies of American presidential elections have used factor analysis to research and examine multiple elections at one time. Two types of factor analysis have been used: the T-mode and the S-mode. The T-mode factor analysis combines elections over several periods of time. The analysis then shows similarities and differences between elections decades apart.
The S-mode type of factor analysis groups areas under study into regions to show similarities in areas. The United States has historically experienced sectional conflict between the southern, the northern and the western states. The S-mode type of factor analysis mathematically demonstrated the long-term influence of sectionalism in presidential elections.
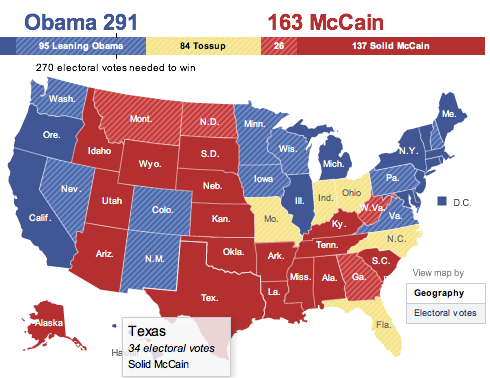
Electoral geography has come to play a significant role in American presidential elections. The president of the United States (and the vice president) are elected by electors to an electoral college. The electors vote for the president and vice president in their respective state capitals. The electors to the electoral college in all but two states vote in a bloc. They vote this way because the vote must be cast according to election laws passed by the dominant party in each of the 50 American states. The two major parties in the United States are the Democrats and the Republicans. The electoral results after an election shown on electoral maps used by the television networks have in recent times been colored red for Republican and blue for Democrats.
RED AND BLUE STATES
After the 2000 presidential election in the United States, pundits began talking about the “red” (Republican) and “blue” (Democratic) states. These terms grew in popularity and were used by the news media to simplify speculations on the vote in the run-up to the election. There were maps easily available through the internet and in newspapers showing the vote for president. The important map was the one depicting the placement of the electoral votes in the states. These became the red and blue states.
However, maps were also easily available that showed the vote for George W. Bush (Republican) and John Kerry (Democrat) by county. There are just a little over 3,000 local units of government in the United States called counties.
In LOUISIANA, the local units are called parishes and are modeled after a French form of government, and in Alaska they are boroughs. For practical purposes they are the same as counties.
While the popular vote was somewhat close, with only 3 million more votes for Bush than Kerry, the geographic distribution was revealing. Maps colored red and blue to show the vote by county showed that Bush had carried 83 percent of the counties in the United States. It also revealed that Kerry's vote was concentrated in large urban areas with heavy African American populations and in some rural counties in the southern states that have majority black populations. It also showed that Kerry carried several Native American reservations and groups of Hispanic voters, such as those on the lower Rio Grande in TEXAS.
The American county election map also showed that Kerry did not carry large areas of the states that he did carry. For example, about half the rural counties of NEW HAMPSHIRE (especially the rural ones) went for Bush, although Kerry carried New Hampshire.
These and other maps were quick used by pundits to explain the vote in the red and blue states in terms of ethnic, cultural, economic, educational factors, and other cultural features such as religious participation. Revealing also was the evidence that many areas voted in a manner that seemed to be opposed to their economic interests. The conclusion quickly drawn by pundits was that these were social conscience votes in support of social policies of the Republicans or the Democrats, or they were votes in support of or in opposition to the war in Iraq. The ongoing politics in America is now clearly utilizing electoral geography to make political arguments.
It is likely that attacks on the electoral college system of voting in the United States will be presented in future decades in terms of electoral geography. The claim that voting by anything other than direct popular election is unfair is frequently urged by political opponents of the electoral college system. It causes the voters of one party in states dominated by another party to “waste” his or her ballot.
This argument is unlikely to be effective because the electoral college, like the representation in the Senate of the U.S. Congress, is weighted in favor of the “small” states. These are usually the least populated states and also those with fewer economic resources. However, the Constitution of the United States was rigged this way in the beginning to give to the small states more power than they would have had otherwise. It means that candidates are encouraged to visit most if not all states in their hunt for votes. A system of direct popular election would eliminate the need to visit most of the areas of the country. Candidates would then concentrate their campaigns on the voters in the large population areas.
Almost immediately after the 2004 presidential election in the United States there was a non-violent revolution in UKRAINE. Voting irregularities, denounced by both Ukrainians and foreign observers, eventually forced a new election that was won by the Ukrainian nationalist candidate and former Prime Minister Viktor Yushchenko. An electoral map of the first and second votes revealed the issues. The Dnieper River was the boundary between majorities of Russian speakers and Ukrainian speakers. The split was between those who wanted to return to RUSSIA and those who wanted to tie Ukraine's future to the NORTH ATLANTIC TREATY ORGANIZATION and the EUROPEAN UNION.
Electoral geography has, through the internet, moved into the mainstream of American politics. It is now commonplace for newspapers to print maps of districts and to provide stories about electoral geography. Electoral geography is also affecting political perceptions in other parts of the world. The future for electoral geography is wide open as liberal democracy or social democracy is adopted by former totalitarian or traditionalist regimes.