How Do We Use Maps and Photographs?
MAPS ARE AMONG OUR MOST IMPORTANT TOOLS for depicting and analyzing spatial information, whether we are interested in environmental issues or election results. Cartographers generate different kinds of maps that are designed to show Earth's landscape features, its weather and climate, and the distribution of plants, animals, or many other types of variables. Some cover […]
Thematic Maps
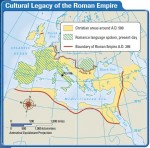
Geographers also rely on thematic maps, which focus on specific types of information. For example, in this textbook you will see thematic maps that show climate, vegetation, natural resources, population density, and economic activities. Some thematic maps illustrate historical trends, and others may focus on the movement of people or ideas. These maps may be […]
Using Different Types of Maps
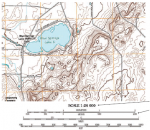
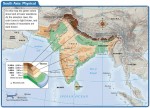
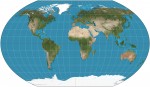
PHYSICAL MAPS Physical maps help you see the types of landforms and bodies of water found in a specific area. By studying the map, you can begin to understand the relative location and characteristics of a place or region. On a physical map, color, shading, or contour lines are used to indicate elevation or altitude, […]
Maps and Cartography
Cartography is the field of geography concerned with making maps. A map is a paper representation of space showing point, line, or area data—that is, locations, connections, and regions. It typically displays a set of characteristics or features of the Earth's surface that are positioned on the map in much the same way that they occur on the surface. The map's […]
Maps and Mapmaking
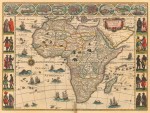
If Africans had a mapmaking tradition before the coming of Europeans, no traces of it survived. The mapping of Africa was carried out largely by Europeans until independent African nations began producing their own maps in the late 1900s. The Greeks created the earliest maps of Africa, and they dealt mainly with the northern and eastern coastlines of the […]
Understanding the Basic Characteristics of Maps
The achievement of cartographic understanding has, as a prerequisite, the understanding of the basic characteristics of maps. Scale, map projections, generalization, and symbolization are common to every map and are considered as basic characteristics of maps. Since map literacy is not systematically included in the school curriculum, there are no definite and clear results referring to children's understanding […]
Nontemporal Animated Maps
Animated maps do not have to depict temporal data. One kind of a nontemporal animated map is a fly over map that simulates the experience of 'flying' over a digital landscape or zooming into or away from a location (as is possible with Google Earth). Most often with fly overs the map itself is static (e.g., the colors of the […]
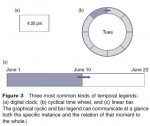
Temporal Animated Maps
Static maps present all of their information simultaneously; animated maps present information over time. Thus, animated maps have an additional representational dimension that can be used to display information. While it obviously takes time for a reader to scan a paper map, such as retrieving specific rates, the overall or holistic impression of the map happens at a glance. Moreover, […]
History of Animated Maps
The history of animated maps is very much tied to the history of computers. Early examples of animated maps were produced in the 1930s using hand drawn, cel based techniques borrowed from cartoon animation. Because these manual techniques were exceptionally time consuming, academic cartographers and computer scientists started experimenting with the potential of computer assisted animation surprisingly early (late 1950s) and […]
The History of Maps and Mapping
That new approach emerged in the 1980s, propelled by factors both external and internal. External to – one might say foreign to – the world of cartography was the French theoretical and philosophical post structuralist movement led by Michel Foucault and Jacque Derrida that had already found fertile ground in the humanities (including geography) in Europe in the late 1970s. […]
Cartobibliography: The History of Printed Maps
The indispensable step in approaching a map (or anything) to be used as evidence is to check its publication history and its credentials as a source in the same way as a bibliographer examines a book. The discriminating description of maps is known as cartobibliography, a term first used in 1914 by George Fordham in the title of […]
Cognitive Maps
The term 'cognitive map' derives from a paper written by Edward Tolman in 1948. Entitled 'Cognitive maps in rats and men', although mainly about rats, it put forward the idea that the rodents built up so called 'cognitive maps' over time that enabled them to steer their way about their environments. Tolman compared the rat's brain to the central office of […]
Agents and Actors: Artists Who Make Maps or Engage in Situated, Locational Activities in Order to Challenge the Status Quo or Change the World
In the twentieth century, particularly during the destruction, chaos, and geo scrambling of World War I, avant-garde artists began not only to take on the iconography of the map but also to envision themselves in the roles of mapmakers, which is to say, capable of leveraging the authority of the map to change the shape of the world. The […]
projection, maps
THE EARTH CAN BE assumed as a perfect sphere for purposes of simplicity. However, in reality there is a large difference between the pole-to-pole distance and the equator distance. The Earth is about 1/300th smaller in its pole to pole distance. This unique shape is called an oblate ellipsoid or spheroid. An estimate of the ellipsoid […]
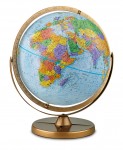
maps and globes
A MAP IS AN abstract representation of a selected set of features on or related to the surface of the Earth. The map reduces these selected Earth features to points, lines, and areas, using a number of visual resources such as size, shape, value, texture or pattern, color, orientation, and shape. Whereas aerial photographs and […]