projection, maps
THE EARTH CAN BE assumed as a perfect sphere for purposes of simplicity. However, in reality there is a large difference between the pole-to-pole distance and the equator distance. The Earth is about 1/300th smaller in its pole to pole distance. This unique shape is called an oblate ellipsoid or spheroid. An estimate of the ellipsoid allows calculation of every point on the Earth, including sea level, and is often called the datum. With time and in different countries many datum have been established.
The current U.S. datum most commonly used is the World Geodetic System 1984 (WGS 84). Map projections are used to transfer the spherical location information on a datum or ellipsoid onto a flat surface. The transformation process always results in distortions in shape, distance, direction, scale, and area. Projections minimize distortions in some of these map properties but at the expense of increasing errors in other properties. Conformal maps preserve shape, as the scale of the map from any point is the same in any direction. Scale is defined as the relation between distances on the map and the same distance on the Earth's surface. Direction is preserved when azimuths (angles from a point on a line to another point) are correct.
In the spherical coordinate system, the Earth is considered to be composed of longitude lines (meridians), which run north-south, and latitude lines (parallels), which run east and west. The longitude lines converge at the North Pole in the Northern Hemisphere and at the South Pole in the Southern Hemisphere. All meridians and the equator are great circles since they can form planes that cut the surface and pass through the center of the Earth. Small circles, such as latitude lines, form a plane that cuts the surface but does not pass through the centre of the Earth.
In this system of reference, geographic coordinates are measured in units of angular degrees. There are 360 degrees of longitude around the equator, with each meridian numbered from 0 to 180 degrees east and west such that the 180 degree meridian is on the opposite side of the Earth from Greenwich. There are 180 degrees of latitude from pole to pole, with the equator being 0 degrees and the north and south poles being 90 degrees.
Each degree can be divided into 60 minutes and each minute is divided into 60 seconds. The northsouth line is called the prime meridian, which has been arbitrarily set to pass through the Royal Observatory in Greenwich, England. The longitude is measured as the angle between the point, the center of the Earth, and the prime meridian at the same latitude. West is positive and east is negative, meeting at 180 degrees at the international date line. The east-west line follows the equator and is midway between the north and south poles. Degrees of latitude are measured as the angle between the point on the surface, the center of the Earth, and a point on the equator at the same longitude.
Other coordinate systems are based on a flat surface. The easiest way to try to transfer the information to a flat surface is to convert the curved Earth locations into an X and Y coordinate system, where X corresponds to longitude and Y to latitude. In order to clarify understanding, the transformation process can be considered as a two-stage process. In the first stage, assume that the Earth has been mapped on a reduced size globe that will produce a flat map of a desired size when unfolded.
In the second stage, each point on the surface of the globe is transferred onto a flat surface. The transformation is usually in the form of mathematical functions and the points are “projected” onto one of three flat surfaces, which can then be unfolded into a chart. The three surfaces are a cylinder, cone, and plane. The lines formed by the latitude and longitude on a map are called the graticule. Latitude or longitude lines where the projection surface and location information about the Earth intersect is called the point of contact or standard line. Distortion is minimized nearest to the standard line. A graphical representation called the Tissot Indicatrix is commonly used to visualize the angular and area distortions that occur across the flat map surface because of the transformation process.
A cylindrical projection places the Earth inside a cylinder with the equator touching the inside of the cylinder. Cylindrical projections are mostly used for areas near the equator. If the axis of the cylinder is placed perpendicular to the axis of the Earth, the resulting projection is called a transverse projection. A cone is placed over the Earth to produce a conic projection. A conic projection is best for middle latitudes.
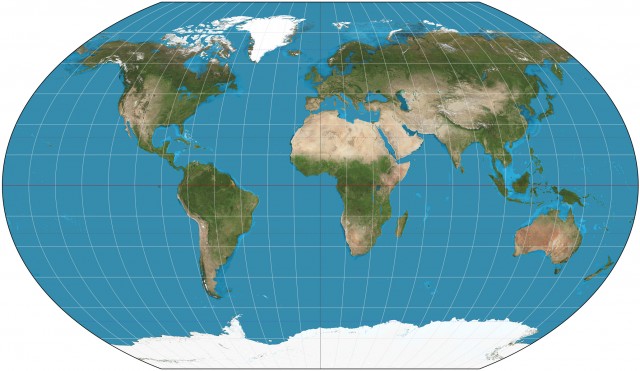
An azimuthal projection places a plane over a point on the Earth. The azimuthal projection is used for polar charts because of distortions at other latitudes. Map projection affect the distance, area and shape, and angle relationships of the Earth features as displayed on the flat map. Equal area projections preserve the property of area. Maps with an equivalent projection show all parts of the Earth's surface with the correct area. However distances along the latitudes are not accurate. Conformal projections preserve the property of shape over small areas. Conformal projections are valuable since they preserve directions around any given point. Moreover, angles relationships within the graticule are shown correctly. Area and shape are normally distorted. Some projections only preserve correct distance relationships along a few places on the map. There may also be compromise map projections. These may be the average of two or more projections in order to minimize distortion. Some examples of the projections mentioned above are Mercator (conformal projection, preserves shape), Lambert Equal Area (equidistant projection, preserves areas), and Robinson (compromise projection, limits area and angle distortion).
When the three-dimensional Earth is projected onto a flat paper map, there are distortions in distance, area, and direction, and the projection process attempts to minimize these distortions when transferring the curved Earth to the flat paper map. On the flat map there is no natural reference point, but one can be defined using an arbitrary system of coordinates. A grid of intersecting parallel and perpendicular lines is placed over the projected map such that the origin of the grid lines falls on a point of interest on the map. This arrangement is called a grid reference system and every point on the flat map can be located with a unique X and Y coordinate. Usually the X coordinates are referred to as “eastings” and the Y coordinate as “northings.”
An example of a grid coordinate system is the Universal Transverse Mercator (UTM) system. The UTM coordinate system is commonly used in geographic information systems because the United States Geologic Survey (USGS) topographic maps use the UTM system. The UTM projection is formed by using a transverse cylindrical projection (the standard line is a line f longitude). The result is to minimize distortion in a narrow strip running pole to pole. UTM divides the Earth into pole-to-pole zones 6 degrees of longitude wide. The first zone starts at the international date line (180 degrees east) and the last zone, 60, starts at 174 degrees east. Northings are determined separately for the areas north and south of the equator. The Southern Hemisphere uses the South Pole, while the Northern Hemisphere uses the equator. Distortion is extreme at high latitudes and so UTM is not normally used above 80 degrees north or south.
Maps provide useful and concise spatial information in a meaningful manner, and we use them directly or indirectly in many aspects of our daily lives. Navigating the roadways, finding new places, or just reflecting on the aesthetics of the map are some examples of how we use maps. Maps are also used as a means for storing data, as a spatial index for labeling features or integrating multiple map sheets, and as a spatial data analysis tool for planning and decision-making. A simple but powerful analysis tool is the map overlay process developed by Ian McHarg in which multiple map layers each on transparent film are overlaid to identify regions of interest.
Understanding projections is especially significant as the concept holds a central position in the design and development of new and emerging spatial technologies such as geographic information systems, remote sensing, and global positioning systems. These technologies provide multiple options to covert among projections. Selecting the correct projection to use must begin with a clearly defined project goal. Thereafter a projection should be selected that has a standard line centered on the geographic region of interest. An assessment of the importance of correct representations of area, angle relations, and distances must also be made. Given these criteria, an appropriate projection for the mapping project can be selected.