How Can Moisture Extremes Be Characterized?
THERE ARE GREAT EXTREMES in the distribution of moisture, with some regions being very dry for an extended period of time, as during a drought, whereas other regions receive huge amounts of precipitation in a short period of time. The cause of these extremes in moisture can be broad regional shifts in the climate or more localized shifts, such as a slight alteration in wind direction that changes local patterns of orographic lifting. Extremes of precipitation, whether too much or too little, are of great concern to physical geographers as they have the greatest impacts on people. Here, we describe several types of extreme events, how we document such events, and how we assess the risks for either too little or too much moisture.
What Causes a Drought and How Can We Quantify It?
Drought is an unusually extended period when losses of surface water to evaporation and transpiration from vegetation in the area are uncharacteristically higher than the addition of water to the surface by precipitation. Drought places stress on plants and animals and can cause normally green and fertile land to dry up into eroded, dusty plains. Drought can cause water shortages by drying up streams and lakes, and by decreasing flow into groundwater. Three causes of drought are described below, but others are also common.
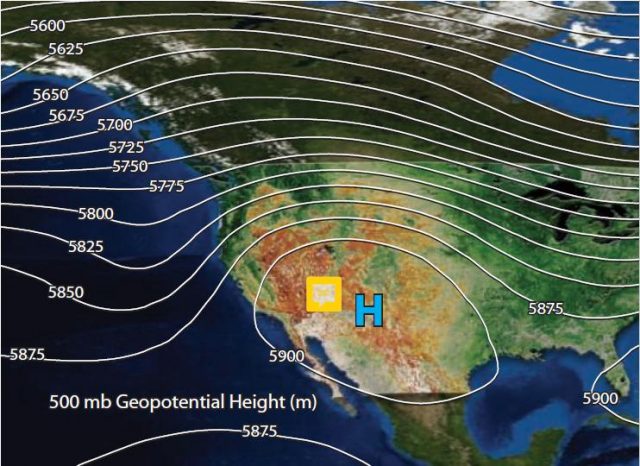
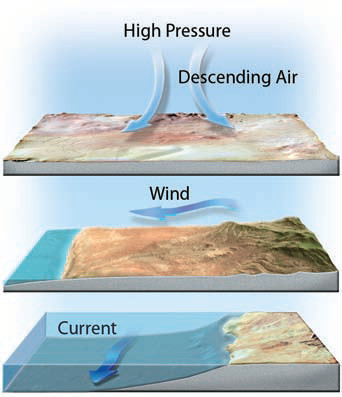
Drought can be caused by weather patterns that are atypical for an area. Persistent high pressure, with its sinking air, can cause a region to be drier than normal. The map on the right shows a large area of high pressure over the Desert Southwest. If such high pressure is persistent, the region can shift into drought conditions.
An unusual change in wind direction, such as one that brings dry air from the land over an area that normally experiences an onshore flow of moist air from the ocean, can cause a drought.
A temporary change in the direction or strength of an ocean current can last multiple years, causing a temporary change in climate, possibly including drought if a cold current results in less moisture in the air.
How Can We Quantify the Risk of Drought?
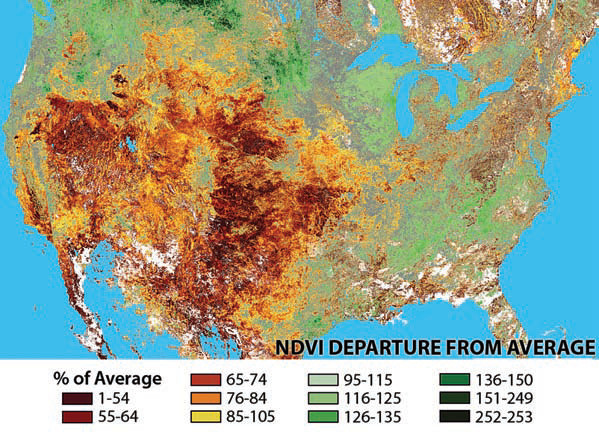
Satellite data, such as this eMODIS image, are used to create drought indices based on vegetation health and other biophysical properties.
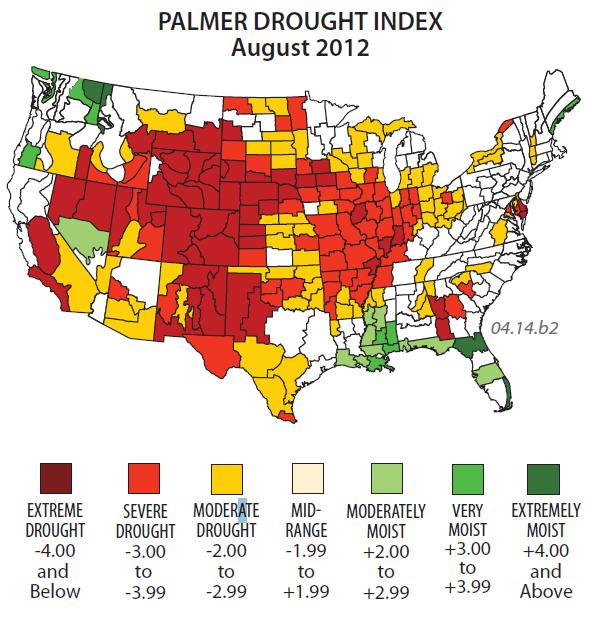
The numerically based Palmer Drought Index (PDI) uses climatic and soil moisture data to quantify the severity of the drought. Status is expressed relative to normal at that location and time of year, such as the values shown on the map here for August 2012.
How Can We Quantify and Depict the Risk of an Extreme Precipitation Event?
An important aspect to consider in planning land use or other activities is how often events of extremely high or low precipitation are likely to occur. We can calculate the average length of time that we would expect to see between events that equal or exceed a given magnitude, the return period. This, also called a recurrence interval, allows geographers, land-use planners, farmers, and others to assess the risk of extreme events and to plan accordingly.
1. To calculate a return period, the first step is to specify the magnitude and duration of a hypothetical extreme event of interest. The magnitude is the amount of precipitation that fell. The duration is the length of time that was required for that amount of precipitation to fall. We then use historical data to find where this event ranks with other events of similar duration. The results are entered into the equation below.
Return Period (RP) = (number of year of record + 1) / (rank of event)
2. To illustrate this concept, we present a simple example. If 8.4 cm of precipitation fell over a 12-hour period at a given place, we could estimate its return period by finding its rank among the largest 12-hour rainfall totals in the 50 years of historic records at that location. If our 12-hour total ranks 30th among all 12-hour totals at the location (in the 50 years during which measurements were taken at that site), the return period would be 1.7 years. This means that we would expect 8.4 cm of precipitation to fall within a 12-hour period at that place once every 1.7 years, on average. Enter these numbers in the equation above and see what you get.
3. There are two inherent dangers with such approaches. First, it is extremely dangerous to extrapolate far beyond the observed historic data. How can we know what a 100-year event is if we only have 50 years of data? And second, people often forget that these numbers are just average return periods. If a 5-year event happened last year, that does not mean that another 5-year event will not occur again this year; it simply means that the magnitude would be expected to occur once every 5 years, on average.
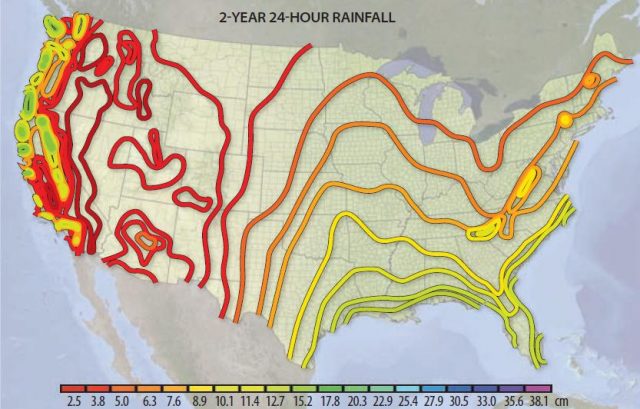
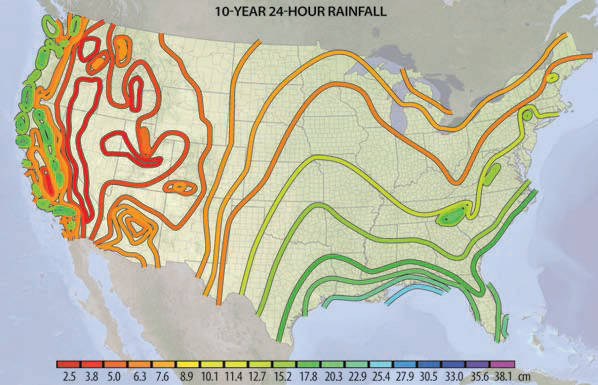
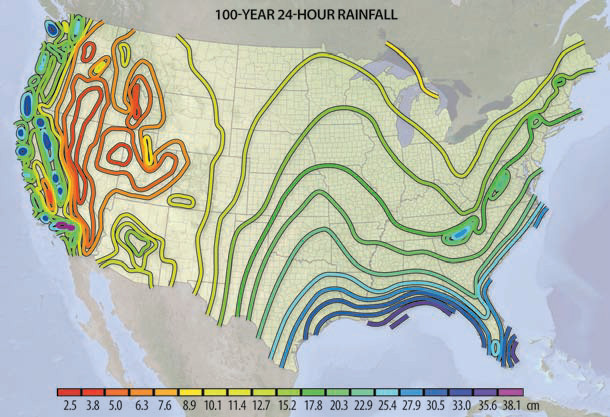
Maps of Return Period
4. Maps of the magnitude of rainfall events for various return periods and durations have been produced. Three are shown here for a 24-hour duration, including one for a 100-year return period. The “100-year storm” is often of interest because many structures are designed to withstand the effects of a 100-year storm. Examine these maps for the area in which you live or have some interest. Consider how such maps might be used, such as when planning land-use near a river or how high to build a new bridge.