How Does an El Niño Start and Stop?
THE ENSO PHASES, EL NINO AND LA NINA, have profound impacts throughout the Pacific basin and neighboring continents. What begins as a local adjustment in sea level and depth of the thermocline in the western Pacific can spread across the equatorial Pacific, triggering an El Nino. Once established, an El Nino directly impacts weather in locations along the western coast of Central and South America and beyond. For these reasons, much effort has gone into devising methods to predict the beginnings and ends of El Nino and La Nina phases.
What Are the First Signs That an El Nino May Begin?
The continually shifting relationship between the atmosphere and ocean means that no true “starting point” exists for the onset of an ENSO-related event, such as the beginning of a warm phase (El Nino). The first obvious sign of El Nino is a temporary weakening of the trade winds just east of the International Date Line (IDL). Another is an increase in atmospheric pressure in the westernmost Pacific, as measured in Darwin, Australia, relative to islands farther east in the Pacific, such as Tahiti. Recall that these were the two sites used to define the Southern Oscillation Index (SOI).
1. During the warm phase of ENSO (i.e., an El Nino), easterly trade winds that normally blow water westward, piling up warm water in the Western Pacific Warm Pool weaken. This causes a mound of warm water, or a wave, hundreds of kilometers wide to start to move to the east, traveling at about 3 m/s. This type of wave is called a Kelvin wave.
2. As the mound of warm water moves east along the equator, it raises sea level by a few centimeters and causes more noticeable warming of the SST. The additional thickness of warmer water depresses the thermocline beneath it, while cooler water rises to the west, elevating the thermocline in reas through which the wave has passed.
3. The combined surface and subsurface perturbations proceed eastward, with the wave moving faster than any individual water molecule. Once set in motion, the wave continues eastward, mostly unaffected by surface winds (lower parts of the wave are too deep). The Kelvin wave moves east until it reaches the shallow seafloor along the west coast of South America.
Motion of a Kelvin Wave
4. A Kelvin wave is detectable from slight increases in sea level as the wave passes islands and buoys in the Pacific. The slight rise of sea level is also measurable by satellites. This image shows not SST, but height of the sea surface (like a topographic map), with red being higher and blue being lower. A Kelvin wave is imaged here as the area of high sea levels (red).
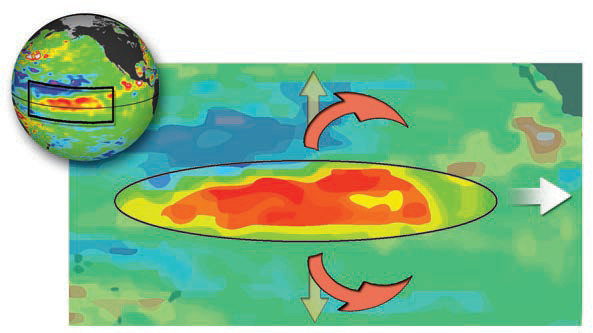
5. An east-west-oriented mound of surface or subsurface waters might be expected to move poleward (parallel to the yellow arrows), away from the areas of higher sea level, dissipating the wave. However, waters that move away from the equator eventually have an apparent deflection from the Coriolis effect. This deflection bends them back toward the equator. As the Kelvin wave moves east, it therefore remains concentrated along the equator by the Coriolis effect and also by the convergence of trade winds along the ITCZ.
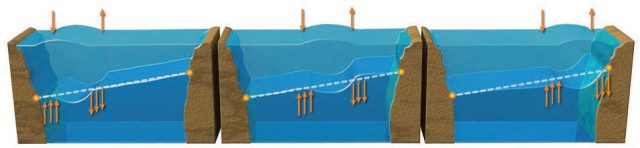
6. This sequence of block diagrams tracks the eastward movement of a Kelvin wave, as recorded by anomalous water heights (top of the block) and temperatures at depth (front of the block). Yellow, orange, and red represent higher than normal heights and temperatures.
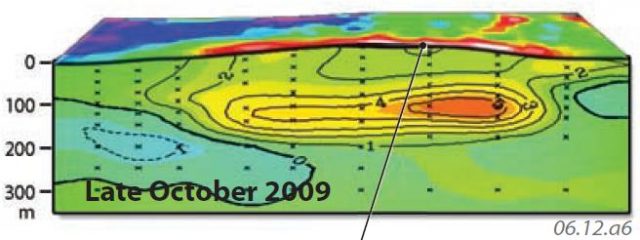
7. The mound of warm water starts in the west and moves eastward along the equatorial Pacific.
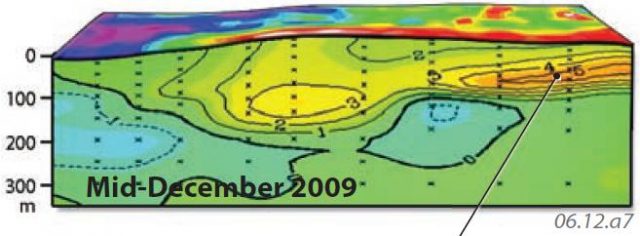
8. The warmer than normal water is concentrated at depth along the thermocline, which is inclined upward toward the east. As the wave moves east, cooler waters (shown in blue and purple) flow in behind it in the west.
What Happens After the Kelvin Wave Hits South America?
The Kelvin wave moves east until it is confronted with the barrier of continental South America. At this point, some waters spread out along the coast, while some are reflected westward back across the Pacific.
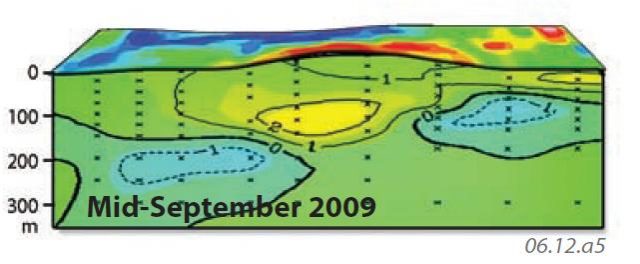
1. The colors on the globe and the top surface of each block diagram again show height of the sea surface, not SST. In red areas, sea levels are anomalously high, whereas they are anomalously low in blue and purple areas. The cross sections on the sides of the blocks indicate temperatures of the sea at various depths, with red being warmest and blue being coldest. They show a progression of what occurs as the Kelvin wave bounces westward of South America.
2. The orange and yellow colors in shallow depths represent the warm remnants of the Kelvin wave, which have started moving west by the time shown here (i.e., the front of the wave has already bounced off South America). The warm waters spread along the coasts to the north and south of where the nose of the wave first impacted the coast. In this way, the oceans west of Peru and Chile have warmed — the signature of El Nino.
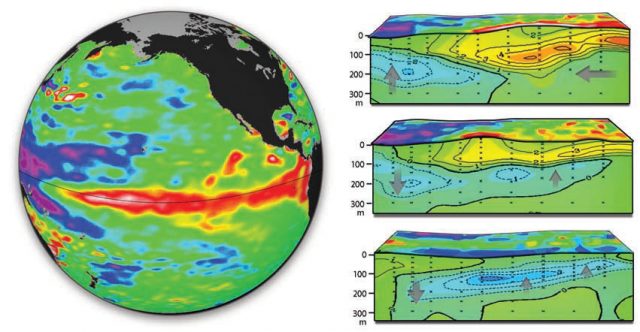
3. Between the top cross section and the middle cross section, the warm waters moved westward and started dispersing, becoming less distinct. As the warm waters move westward, note that colder waters (the blue and green at depth) begin to extend eastward beneath the warm waters.
4. As the warm water spreads out away from the equator, cold waters from depth upwell into the area vacated by the spreading waters — causing the termination of El Nino. Eventually, warmer than usual conditions prevail in the western Pacific and cooler waters return to the east, the exact pposite
of El Nino and the signature of La Nina, the cold phase of the ENSO phenomenon.
Predicting El Nino
The severe effects of El Nino on the commercial fishing industry of Peru and nearby countries, and the wide-reaching climatic impacts, have led overnments to invest significant resources toward studying and predicting ENSO events, especially El Nino. In recent decades, warm phases of ENSO (El Nino) have displayed a tendency to reoccur about once every 5–7 years and to last 12 to 18 months. A severe El Nino in 1982–1983 caused much damage to the economy of Peru, prompting more detailed study of the phenomenon. As a result of these efforts, scientists predicted major El Nino events in 1986–1987 and 1997–1998, allowing the affected countries to prepare for the crisis.
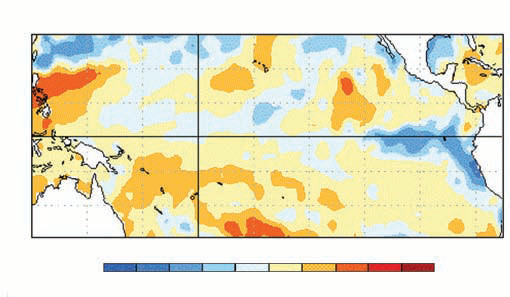
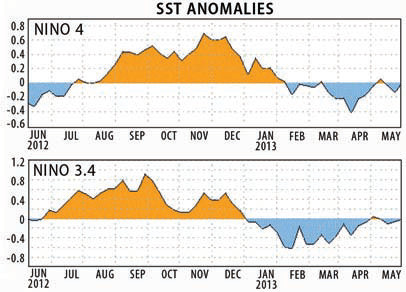
The types of data considered in these predictions include changes in atmospheric pressure (e.g., SOI), SST (measured by ships, buoys, and satellites, shown in the map to the right), observed decreases in the trade winds, and relative changes in sea level between sites in the western Pacific versus those farther east. The various types of data are processed and modeled using supercomputers because the number of variables and number of computations are both substantial. Some models try to simulate nature by using complicated equations of atmospheric and oceanic motion and energy transfer, and others try to identify the “fingerprint” of an ENSO event from records of past events. A common forecasting tool is to calculate and plot graphs of SST anomalies over time (as in the graph to the right), for different regions of the Pacific (numbered NINO 1, 2, 3, and 4). It is an evolving and exciting field of study, with important implications for our understanding of regional and global climates and how they change.