What Are El Niño and the Southern Oscillation?
THE MOST WELL KNOWN AND PUBLICIZED cause of climate variability, floods, droughts, hurricanes, heatwaves, and landslides is a change in the strength of winds and ocean currents west of South America in what has become known as El Nino. El Nino is one expression of the ocean-atmosphere system operating over and within the equatorial Pacific Ocean. Phenomena associated with El Nino are more correctly termed ENSO because they involve oceanic (El Nino, EN) and atmospheric (Southern Oscillation, SO) components, which are linked but respond at different rates. This difference in speed of response, combined with the linkages between the two systems, leads to the intrinsically erratic nature of ENSO.
What Is El Nino in Its Strictest Sense?
The waters off the coast of northern Peru are generally cold, as shown in this map of SST, because the north-flowing Humboldt Current brings very cold water from farther south. The cold character of these waters is intensified by the upwelling of cold water near the shore. This upwelling occurs because warmer surface waters are pushed westward, away from shore, by dry southeasterly trade winds descending over the Andes and by complex sea motions. The cold upwelling limits evaporation, producing a dry desert coastline, but it brings to the surface nutrients that nourish plankton and cold-water fish like anchovy.
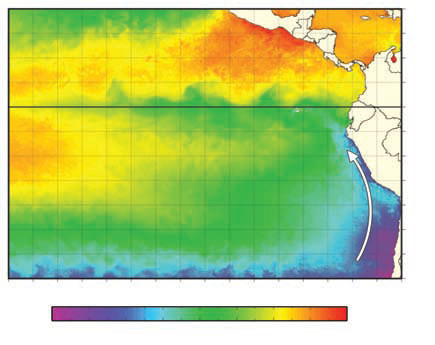
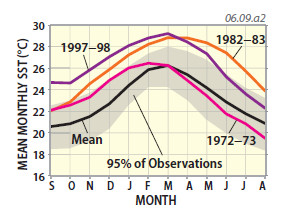
Fishermen noted that the waters began warming toward the end of November and early in December (Southern Hemisphere summer), heralding the beginning of the Christmas season. They named this local phenomenon “El Nino,” in reference to the boy child or “Christ child.” Occasionally, as in 1972–73, 1982–83, and 1997–98, the warming is exceptionally strong and persistent, referred to as a strong El Nino pattern. This brings abundant rains to the region, with flash flooding inundating extensive areas. The anchovy and accompanying ecosystem of birds and sea mammals disappear, and the fishing industry collapses.
What Is the Southern Oscillation?
1. Associated with changes in the strength of El Nino are fluctuations in air pressures in the Pacific. This map shows surface air pressures for part of the Pacific Ocean, centered on the equator. Low pressures are darker, whereas high pressures are lighter in color. Sir Gilbert Walker noticed that when air pressure increased in Darwin, Australia, air pressure typically decreased in Tahiti, a cluster of islands farther east in the central Pacific. When pressure decreased in Darwin, it increased in Tahiti. Walker termed this the “great east-west swaying” of the equatorial atmosphere — the Southern Oscillation. Even though it is an equatorial oscillation, it seemed “Southern” to Walker, so it retained this misnomer.
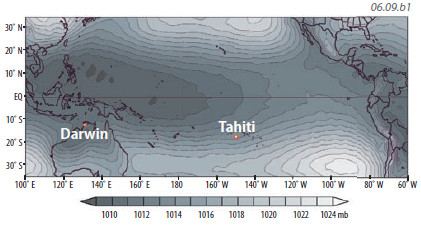
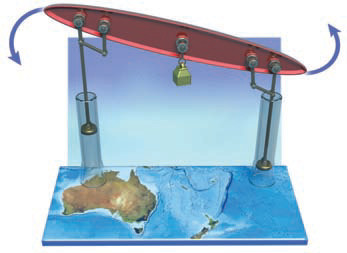
2. Walker envisioned these coordinated fluctuations in air pressures — the Southern Oscillation — as the ascending and descending limbs of a Walker cell over the Pacific. These fluctuations can be portrayed by a simple system, where a change in the air pressures in one limb of the cell is matched by an opposite change in pressure at the other limb. For the Walker cell in the Pacific, conditions at Darwin, Australia, represent the ascending limb (near the warm pool, on the left) and those at the Pacific island of Tahiti represent the descending limb (on the right).
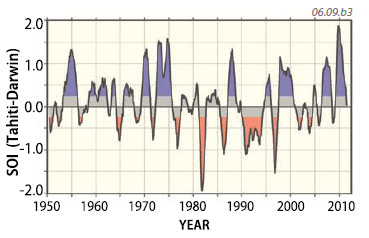
3. To quantify these changes in pressure, Walker created a Southern Oscillation Index (SOI), which represents the difference in air pressure between Tahiti and Darwin. We calculate it simply by subtracting the air pressure measured at Darwin from that measured at Tahiti. If air pressure is higher at Tahiti than at Darwin, the SOI is positive. If air pressure is higher at Darwin than Tahiti, the SOI is negative. Patterns of alternating fluctuations are apparent in the plot above, which compares pressures to the long-term mean. The graph shows that the SOI switches back and forth from positive to negative modes, generally every couple of years. We can anticipate that as air-pressure patterns change, wind directions should also change.
How Is the Southern Oscillation Linked to World Weather?
The Southern Oscillation represents a major shift in air pressure, winds, and other factors in the equatorial Pacific, but Walker recognized that changes in the Pacific correlated with changes in weather elsewhere in the world. To investigate these changes, he hand-plotted air-pressure measurements on a world map (top map below). There is a remarkable correspondence between one of Walker's hand-calculated maps and output from a supercomputer (bottom map).
1. Walker's map, drawn in 1936, showed which parts of the globe had air pressures that correlated with the Southern Oscillation Index (SOI), based on observations from only 50 weather stations. Numbers on the map indicate the strength of the relationship, or correlation. Relationships within the area defined by the solid lines are (statistically) significant. The dotted line separates areas in which pressures fluctuate in the same way as Tahiti (positive numbers) from those in which fluctuations are in the opposing direction (negative numbers).
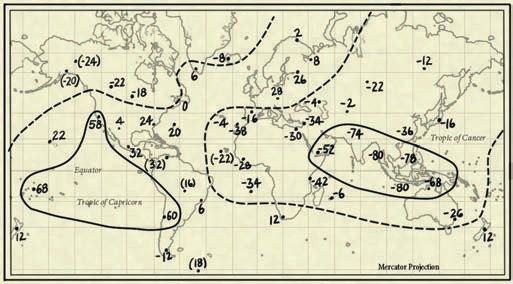
2. Even this early map demonstrates that extensive areas over Australasia and the Indian Ocean, as far as India and Africa and portions of the eastern Pacific, display significant and opposing relationships to shifts in air pressure represented by the SOI.
3. Today we still use Walker's idea of the Southern Oscillation, except Walker used a different sign convention for this particular kind of map. This modern map, based on the National Center for Climate Prediction's global climate model, displays correlations in tenths.
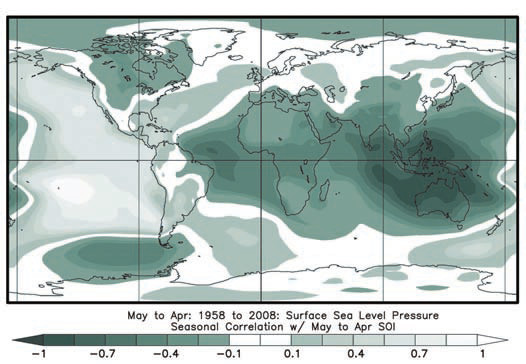
4. Positive associations, represented by shades of light gray, occur in the eastern Pacific, stretching from southern Chile to California. When the index is positive (reflecting higher pressures at Tahiti), these areas will also experience higher pressures and probably less rain. When the index is negative (higher pressures at Darwin), they will experience lower pressures and, in all likelihood, more rainfall.
5. Negative values are extensive, covering Australasia and Maritime Southeast Asia, and stretching across the Indian Ocean as far as India and Africa. These areas will have lower pressures and probably more rain when the SOI is positive (higher pressures at Tahiti) and high pressures (less rain) when the index is negative.
6. The dynamics of ENSO are intimately related to the nature of the thermocline across the equatorial Pacific. Recall that oceans have an upper surface layer that is generally impacted by insolation, with temperatures declining with depth. The transition between the warmer and cooler waters occurs along a clearly defined layer where temperatures cool rapidly with depth, called the thermocline. Since water temperature and density are related, this thermocline corresponds to a similar marked change in density.
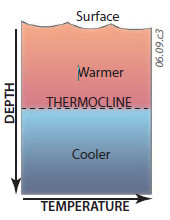
7. During an El Nino, the thermocline becomes lower in the eastern Pacific, a further expression of the abundance of warm water near the surface and an associated decrease in the number of cold-water fish caught in the region. The following two pages describe the different phases and manifestations of ENSO, including the response of the thermocline.
8. As recognized by Walker, the effects of ENSO are widespread across the Pacific, affecting weather from the westernmost Pacific (e.g., Sulawesi) to South America (e.g., Ecuador), and all the islands in between (e.g., Galapagos). These events affect sea and land temperatures, air pressures, wind directions, rainfall amounts and seasonality, and other important aspects of weather.