Atmosphere-Ocean-Cryosphere Interactions
OVER 70% OF THE PLANET'S surface is covered by oceans, which exchange energy and moisture with the overlying atmosphere. Oceans move in response to three main factors — winds moving over the top of them, spatial variations in the density of water, and the Coriolis effect. In addition to responding to wind directions, oceans in turn affect the temperatures and pressures of the adjacent atmosphere. These two major systems of the Earth — oceans and atmosphere — are closely connected and constantly interacting. These interactions are the major causes of climatic variability around the world.
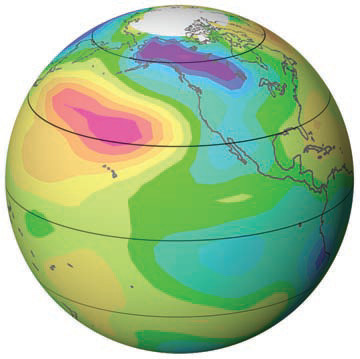
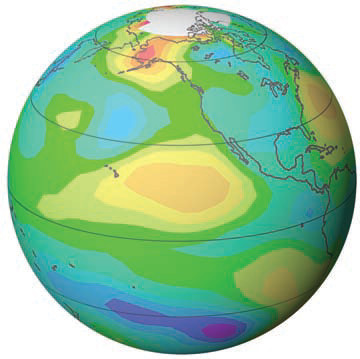
These two globes represent temperatures during two time periods, one from 1964–1976 and one from 1978–1990. Specifically, the globes show how average land temperatures and sea-surface temperatures (SST) during these two time periods departed (differed) from long-term averages. For each globe, the average temperature for that time period was compared to average long-term temperatures. If the temperatures during that time were warmer than the long-term average, the values are positive (shown in red, orange, and yellow). If the temperatures during that time period were colder than the long-term average, the values are negative (shown in purple, blue, and green). Observe the two globes for large-scale patterns and for changes between the two time periods.
What patterns do you observe and what happened to cause such different patterns over time?
Temperature Departure from Average (1964–1976)
Northwestern North America, especially Alaska, was colder than normal for those locations, as shown by the purple and dark blue colors over land, from 1964 to 1976. The adjacent waters of the Pacific were also relatively cold, but only along the western coast of North America. The colder than normal temperatures continued south into southwestern North America and adjacent waters. In contrast, waters farther out in the Pacific were warmer than usual, as depicted by the large region colored red and orange.
Temperature Departure from Average (1978–1990)
A shift in regional temperatures occurred around 1977, as shown by the different patterns between the globes. Alaska and adjacent waters of the eastern Pacific warmed significantly, as reflected by red and orange areas over Alaska. In contrast, cooling occurred in the middle of the northern Pacific, as indicated by the blue and green colors. The patterns in these two globes are nearly opposites, representing two common modes in temperatures in this region: a cool phase, in which SST are cooler than usual in the eastern north Pacific near Alaska and warmer than usual in the mid-north Pacific, and a warm phase, with the opposite pattern. The switch from one mode to another is named the Pacific Decadal Oscillation (PDO).
What causes warming or cooling of sea-surface temperatures, and how can one part of the ocean be colder than normal while another part is warmer than normal?
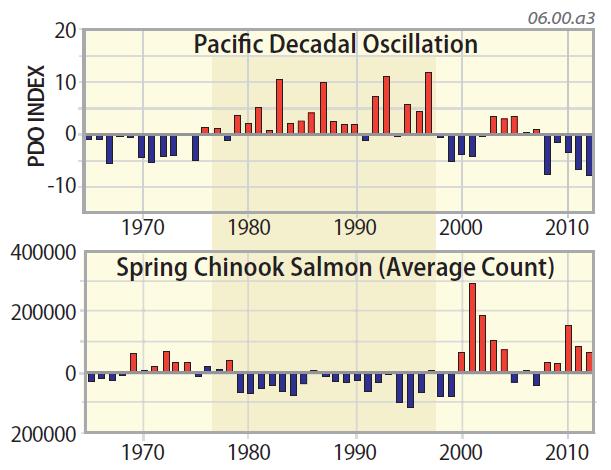
Regional changes in SST can be quantified by statistically comparing SST in the eastern and western Pacific and calculating an index (called the PDO index) that represents the difference. When the waters off Alaska are warmer than those in the central Pacific, the PDO index is positive. The top part of the graph to the right plots the PDO index for the years 1965 to 2010 and shows a major shift in climate at about 1977 — the same temperature shift represented by the difference in the two globes. Red bars represent the warm phase.
What is an ocean oscillation, and do similar oscillations occur in other parts of the Pacific or even in other oceans?
Why are the patterns on these two globes the opposite of each other, and what causes these shifts, as part of the PDO?
The Pacific Decadal Oscillation, including its warm and cool phases, was first recognized by a fisheries scientist trying to explain year-to-year variations in how many salmon return to their spawning grounds in streams along the Pacific, as shown in the bottom graph. Comparison of the graphs reveals a striking correlation — the number of spawning salmon is higher than average during cool phases of the PDO and less during warm phases.
What causes these warm and cool phases in an ocean?
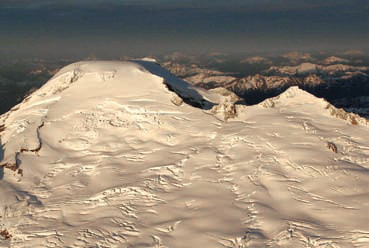
This shift in climate in the northern Pacific correlates with a change in glaciers on Mount Baker, one of the large volcanic mountains in the Cascade Range. As shown in the graph above, glaciers were advancing before this shift (during the cool phase) and retreating after it (during the warm phase). As shown on the graph of PDO index on the previous page, sometime around 1998 the PDO went back into a cool phase, heralding the return of cooler temperatures.
Do ocean oscillations affect the amount of precipitation and global amounts of ice?
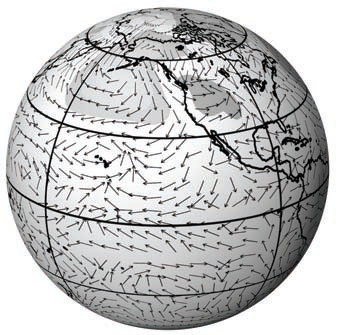
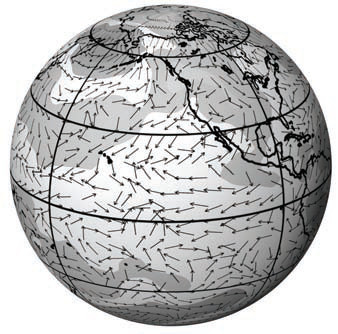
Shifts in the PDO are accompanied by changes in winds and air pressure. The two globes above show anomalies (departure from average) in wind directions (arrows) and surface air pressure (shading, where dark gray is lower pressure). During a PDO cool phase (left globe), the Aleutian Low is very weak and even has clockwise anomalies to the flow. This gives the Alaska coast the cold temperature anomalies that characterize the cool phase. During a PDO warm phase (right globe), the Aleutian Low is much lower, and counterclockwise winds around the Aleutian Low bring warm SST to Alaska's coast. Since wind directions are controlled largely by differences in air pressure, the patterns of air pressure also differ between these two phases. How do changes in SST relate to changes in air pressure and wind direction? Do the oscillations cause the wind patterns or vice versa, or are both related to changes in air pressure?
The PDO and Climate
In 1977, a major shift occurred in the patterns of sea-surface temperatures (SST) in the North Pacific. Before that time, waters in the Gulf of Alaska had been relatively cool, while waters in the central north Pacific had been warmer than normal. After 1977, the patterns switched, with warmer than normal waters along the coasts of Alaska and British Columbia, but colder than normal waters in the central north Pacific. This change, sometimes called the Great Pacific Climate Shift, had profound implications for conditions on land in western North America and in the Pacific. This shift correlated with changes in glaciers, temperatures on land, and the number of spawning salmon.
In the past several decades, this climate shift has been recognized as part of a series of cyclical changes in large-scale patterns in air pressure, wind directions, and sea-surface temperatures, where the Pacific Ocean has two dominant modes: a warm mode and a cool mode. From data collected over the last century, scientists have been able to establish that the Pacific Ocean stays in the warm mode for several decades before switching to the cool mode for the next several decades: thus the “decadal” part of the Pacific Decadal Oscillation name. The term “oscillation” refers to a climatic condition, such as air pressure or sea-surface temperatures, that shifts back and forth between two distinct modes or phases. The Pacific Decadal Oscillation is but one such oscillation. Similar oscillations, described in this chapter, occur in the equatorial Pacific, Atlantic Ocean, and Indian Ocean, each greatly impacting regional climate.