What Caused the Recent Great Plains Drought?
PARTS OF THE GREAT PLAINS, stretching from Texas to Montana, experienced severe drought in 2012, resulting in huge crop losses and other problems. These losses occurred in spite of recent technological advances, such as improved soil and water management practices and the use of drought-resistant varieties of crops. Some effects, such as crop loss, resulted directly from the event, but others, such as less food for livestock, were indirect results of the drought. What caused this drought, and what were some primary and secondary impacts?
What Was the Meteorological Setting of the Drought?
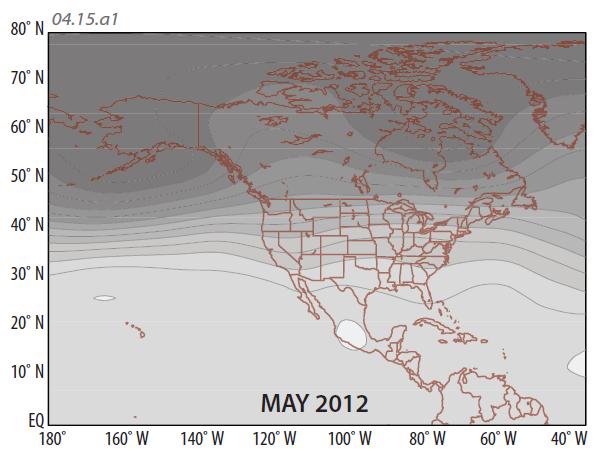
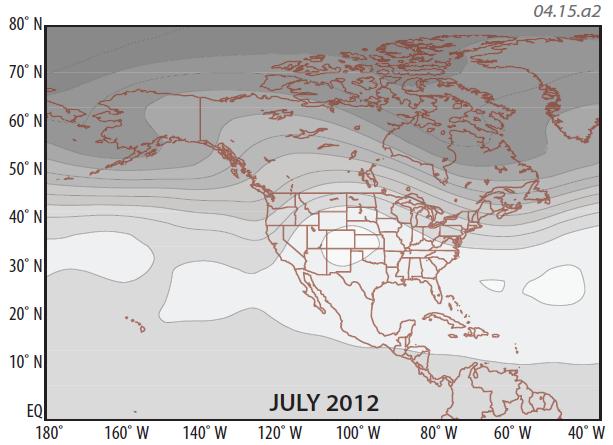
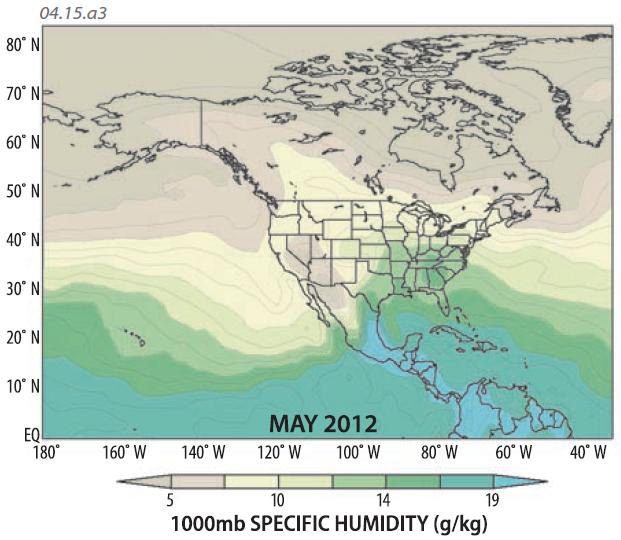
Examine each pair of maps. The top maps show averages of the daily pressure (as represented by the height of the 500 mb pressure) for May and July of 2012. The bottom pair of maps shows specific humidity for the same two months. Compare the air pressure maps to the specific humidity maps and consider the relationship between the patterns of air pressure and humidity, if any exist.
Air Pressure
In May, the air pressure patterns and upper atmosphere wind directions over the lower 48 states were essentially west-to-east, a condition meteorologists call a zonal flow. Pressures over the Great Plains were neither much higher nor lower than areas to the east and west. For most places, a zonal upper-level pattern results in typical weather, because it neither supports nor suppresses storms. For Texas, a west-to-east zonal flow brings in dry air from northwestern Mexico and the Desert Southwest (e.g., Arizona).
By July, a strong ridge of high pressure developed over the Great Plains states, with the entire southern U.S. under high pressure (high 500 mb heights). The sinking air associated with this high pressure caused abundant adiabatic warming and compression, and little cloudiness and precipitation. High pressure also blocked or deflected storm tracks away from the region. As a result of these factors, drought extended across most of the central U.S., including much of the Great Plains.
Specific Humidity
These two maps show specific humidity (the mass of moisture in a mass of air) for the same two months as shown above. Darker shades of green represent more moisture, whereas lighter shades indicate drier air. During May, dry air in the Desert Southwest (e.g., Arizona) and in the deserts of adjacent northern Mexico spread into west Texas, but moderately humid conditions existed in much of the Great Plains, such as in Kansas and Nebraska.
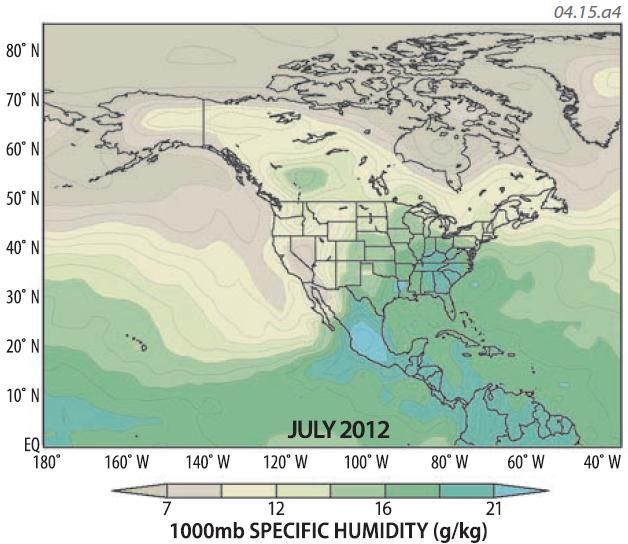
The specifichumidity map for July is not too different from the one for May. The clockwise flow around the Bermuda-Azores High, which makes its northernmost approach in July, has advected moisture into the interior of North America. A conclusion you can reach from comparing the four maps on this page is that the upper-level conditions were very different, but the amount of moisture in the air was similar, although the patterns differ in detail.
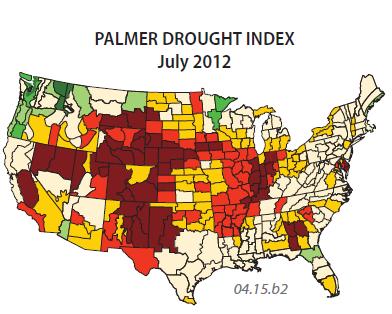
What Were the Patterns of Drought in the Middle of 2012?
The two maps below show the Palmer Drought Index for the same two months as depicted on the previous page. Examine the patterns of drought on these maps and compare them to the maps of air pressure and specific humidity. From comparing each set of maps, decide if the drought in the Great Plains was mostly caused by a lack of humidity or by upper-level air pressure and patterns of flow.
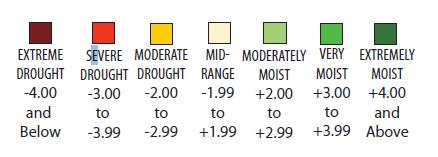
On these maps, areas experiencing severe and extreme drought are shown in orange and brown, respectively. Areas in light yellow are experiencing mid-range conditions, meaning not overly dry or overly moist. In May, areas of the Great Plains with extreme drought are mostly restricted to isolated areas in northern Texas, eastern New Mexico, and especially southeastern Colorado. In the central and northern parts of the Great Plains, from Oklahoma to North Dakota (a north-south strip through the center of the map), conditions were in the mid-range.
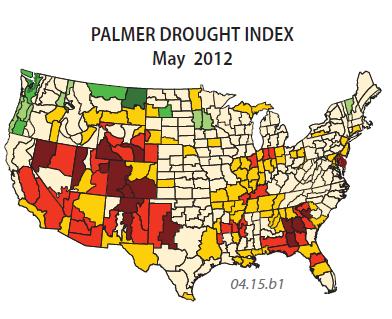
By July, extreme and severe drought had spread across more of northern Texas, eastern New Mexico, and into parts of Kansas, Nebraska, Wyoming, and the Dakotas. Nearly all of the Great Plains was experiencing at least moderate drought (dark yellow, orange, or brown). From your comparisons of these maps with those of air pressure and specific humidity (on the previous page), what do you conclude about the main cause of the drought inflicted on the Great Plains in the summer of 2012?
Primary and Secondary Impacts of Drought
In considering the effects of drought, some effects, such as drying out of agricultural fields and dying of crops, are due directly to the drought; these are primary impacts. Other effects are related to drought, but in a more indirect way, like an increase in the price of seeds that resulted from the initial dying of crops; such effects are secondary impacts. Here, we examine the primary and secondary impacts of the 2012 drought, focusing on Texas, but similar consequences of the drought were felt in other states.
An obvious primary effect of the drought was damage to crops due to the extreme dryness of the soil and lack of rainfall. In Texas, half of the cotton crop was lost, and the corn harvest decreased by 40%. In a similar manner, it is estimated that up to 10% of the trees in Texas were damaged, but it is still too early to be certain about the actual amount of loss.
Wildlife populations dwindled as their habitats were degraded. Ranching likewise suffered the effects of the drought, with a sharp decrease in the number of cows. Such losses were largely caused by a diminished supply of drinking water or an increase in water contamination as ponds and other sources of surface water dried up. Throughout the drought-stricken region, the supplies of surface water and groundwater decreased, with reservoirs estimated as 40% below normal.
There were also secondary impacts. The dry conditions caused grass and brush to dry out (a direct impact), causing a series of wildfires that burned over 3 million acres in Texas, causing more than $750 million in damage to homes (a secondary impact). Trees and plants stressed by the drought became more vulnerable to later disease and pest infestations. High temperatures and low water levels (primary impacts) led to low amounts of dissolved oxygen in some lakes, ponds, and streams, resulting in fish dying (a secondary impact). Reduced seed production altered the food chain, even for species that weren't affected by the drought directly. Shrinking supplies of agricultural products resulted in higher prices.
Other secondary impacts are even less obvious. Transportation was delayed or halted along highways because of wildfires. Tourism decreased as fewer people visited lakes because the low water levels left an unpleasant and potentially dangerous situation for boaters. Also, the amount of recreational fishing declined for the same reason and because of the previously mentioned fish kills. Reduced water supplies in cooling reservoirs used by power-generation plants caused a reduction in power output, at the same time that energy demand peaked due to the higher temperatures (more air conditioning needed). This resulted in rolling blackouts, providing an excellent example of a secondary impact. Geographers also use the concepts of primary and secondary impacts for other types of meteorological events, such as hurricanes and flooding. These terms are also considered in the context of global and regional changes that result from climate change and other events.