What Do Smoke Plumes Tell Us About Atmospheric Conditions?
THE INTERACTION OF MOISTURE and varying degrees of instability in the atmosphere produce clouds, fog, and precipitation. Clues about local moisture and stability characteristics can be gained simply by looking at evidence in the everyday world. Plumes of smoke or steam coming from the top of smokestacks provide such evidence. In this investigation you will observe smoke plumes and make inferences about the stability of the local atmosphere. Through this process, by simply observing a plume, you can be a reasonably effective weather forecaster.
Goals of This Exercise:
- To recognize the variety of forms displayed by plumes of smoke and steam.
- To correlate the shape and intensity of these forms to atmospheric moisture and stability conditions.
- To use the evidence from plumes to predict the local weather conditions.
What Are Some Possible Shapes of Plumes of Smoke and Steam?
When smoke or steam exits from the top of a smokestack, several things can happen. If there is no wind, the smoke or steam will likely simply rise and spread out, diffusing into the local atmosphere. If the wind is blowing, however, the plume will deflect sideways in a downwind direction. The path of the plume depends on how rapidly the plume is rising relative to how fast the wind is blowing. The degree to which the plume moves vertically depends on the stability conditions of the atmosphere, so the shape of a plume can be used to predict the weather. Five types of plumes can be used to assist in making these predictions. Observe each of the five types and then read the text associated with each.
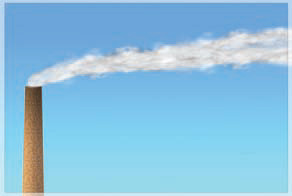
Fanning Plume — This type of plume spreads out horizontally, but not as much vertically. This form of plume suggests that the local atmosphere resists upward or downward motion.
Coning Plume — Some plumes spread out evenly up, down, and sideways, resulting in the shape of a sideways-oriented cone. In such plumes, the smoke shows no real preference for moving up or down.
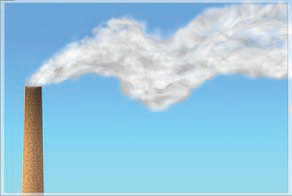
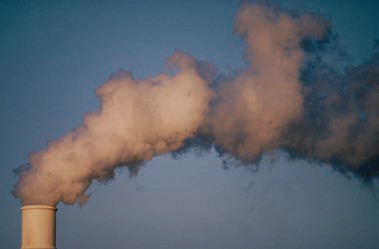
Looping Plume — The plume shown above has the form of up-and-down curves or “loops.” A “looping” form indicates that turbulence and vertical movement are occurring. The plume alternately encounters upward and downward rushes of air, with lulls in between.
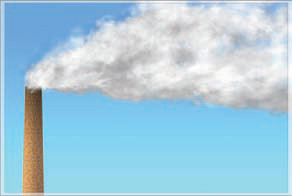
Fumigating Plume — This form of plume expands downward, causing the area downwind to become fumigated with smoke or steam. A fumigating plume indicates that the air is preventing the plume from rising but allowing it to expand downward.
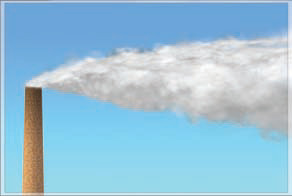
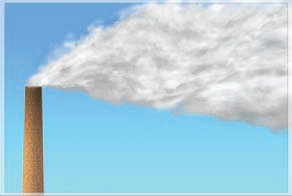
Lofting Plume — A lofting plume is the opposite of the fumigating plume, in that it expands upward but not downward. The atmospheric conditions are allowing the plume to rise and expand upward, but not to expand downward.
Note: Keep in mind that wind speed affects the plume's appearance. A strong wind would favor a fanning plume, as wind pushes the plume downwind faster than it can spread out. In contrast, a light wind would accentuate any looping characteristics of a plume. Also, the dispersion characteristics shown here are only representative of the atmosphere at the top of the smokestack. Conditions higher in the atmosphere might be different, and the plume could have a different shape if it were higher (or lower).
What Do Plume Shapes Indicate About Stability of the Atmosphere?
The form of a plume provides clues about whether the atmospheric conditions favor rising of the air (an unstable atmosphere), sinking of the air (very stable atmosphere), or something in between. The relative stability or instability of the atmosphere in turn provides some constraints on how the saturated and unsaturated adiabatic lapse rates compare to the environmental lapse rate, as summarized below. After reviewing these considerations, match each of the plumes shown on the facing page with the most likely configuration of the environmental and adiabatic lapse rates, from the choices presented in the five graphs near the bottom of this page.
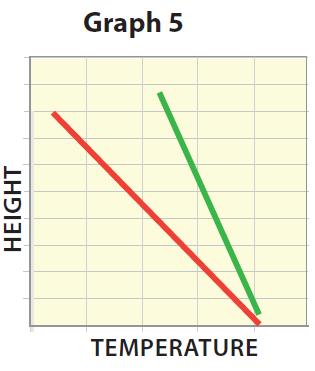
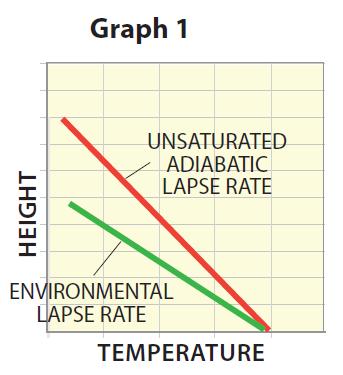
1. The graph, similar to ones presented earlier in the chapter, plots different possible environmental lapse rates associated with an adiabatically moving parcel of air. The unsaturated adiabatic lapse rate is shown by the red line — we are assuming an unsaturated atmosphere in this example. In green are four different environmental lapse rates with varying steepness. In the case of smokestacks, we are interested in comparing the unsaturated and environmental lapse rates.
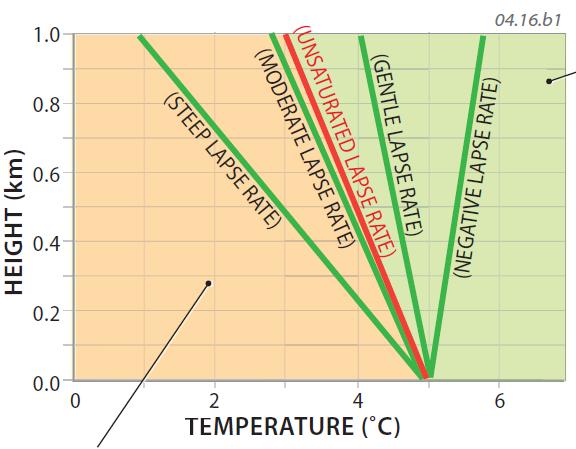
2. If the environmental lapse rate plots to the left of the unsaturated adiabatic lapse rate (as in the orange area on this graph), the adiabatically rising air parcel is warmer than the surrounding environment at a given height, so the air continues rising and the atmosphere is unstable.
3. If the environmental lapse rate plots to the right of the unsaturated adiabatic lapse rate (the green area on this graph), the adiabatically rising air parcel is cooler than the surrounding environment at a given height. The air parcel will cease rising because it has a higher density than the surrounding air, and will tend to sink, so the atmosphere is stable. This is typical, for example, when there is a temperature inversion — warm air above colder air, a negative lapse rate and a very stable situation.
4. If the environmental lapse rate and unsaturated adiabatic lapse rate are about the same (i.e., the two lines plot close to one another as in the center of the graph), the atmosphere can be thought of as having a relatively neutral effect on rising or sinking air.
The graphs below represent five different atmospheric conditions by comparing the environmental lapse rate (the green lines) with the unsaturated adiabatic lapse rate (the red lines). Examine each graph and consider what that graph indicates about atmospheric conditions — whether the air is unstable, stable, neutral, or features a temperature inversion. Then, determine the best match between a graph and the expected form of a plume under those conditions. Enter all your answers in the worksheet or online.
1. Graph 1 has an environmental lapse rate that plots to the left of the unsaturated adiabatic lapse rate. At all levels, adiabatically rising air will be warmer than the air around it.
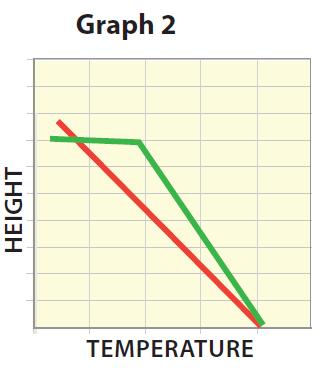
2. Graph 2 shows an environmental lapse rate that is to the right of the unsaturated adiabatic lapse rate below the height of the smokestack, but plots to the left for levels above the height of the smokestack.
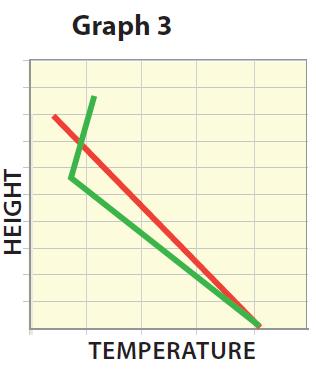
3. Graph 3 has the environmental lapse rate slightly to the left of the unsaturated adiabatic lapse rate below the height of the smokestack, but to the right for levels higher than the smokestack.
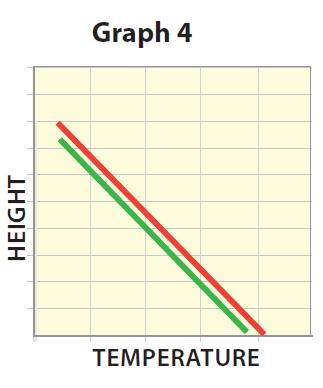
4. Graph 4 has the environmental lapse rate and the unsaturated adiabatic lapse rate nearly parallel and plotting very close to one another.
5. Graph 5 has an environmental lapse rate well to the right of the unsaturated adiabatic lapse rate. At all levels, adiabatically rising air will be cooler than the air around it.