Do Other Oceans Display Oscillations?
ENSO REMAINS THE GREATEST CAUSE of climatic variability on a global scale, but oscillations have been identified in other ocean basins and shown to have regional impacts. Whether these phenomena are linked or “coupled” with ENSO is still debated, but they may be responsible for long-term variations in our climate. One such oscillation occurs in the Indian Ocean, and another occurs in the Atlantic Ocean, both of which are described here. A third oscillation occurs in the Pacific (the PDO) and was presented at the beginning of the chapter.
Is ENSO Linked to Climate Variability Around the Indian Ocean Basin?
The Walker circulation cell over the Pacific shares a common ascending limb with a similar cell over the Indian Ocean. It is reasonable to assume, therefore, that atmosphere-ocean interactions in both may be linked, like two giant atmospheric gears that are meshed over the warm pool in the western Pacific and eastern Indian Ocean. Changes in the strength or location of that warm pool likely has consequences for areas bordering the Indian Ocean basin.
1. The atmosphere over the Indian Ocean features a Walker-like cell, with ascending air over the warm pool on the eastern side of the ocean, near Indonesia, northern Australia, and Australasia. This convectively rising air produces clouds and precipitation in these areas.
2. The rising air flows west once it nears the tropopause and then descends over the western equatorial Indian Ocean, off the coast of Africa.
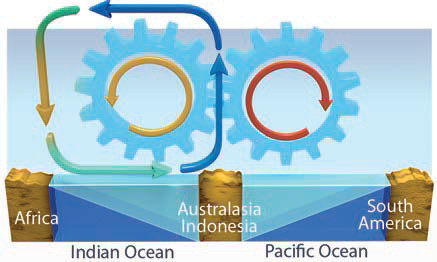
3. The descending air then flows east across the surface of the Indian Ocean, to once again join the ascending limb over Australasia and Indonesia. This circulation is called the Indian Ocean Dipole (IOD).
4. We study variations in circulation by examining differences in SST and pressures between an eastern area near Sumatra (near the ascending cell) and a western area off the coast of Africa (under the descending cell). These two locations are shown on the SST map below, on which orange shows areas that are warmer than average and blue and green shows areas that are colder.
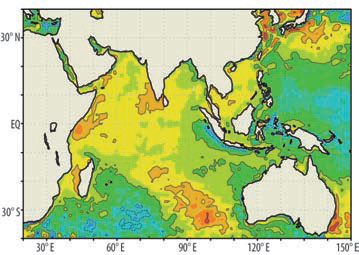
5. This map shows SST for 1997, a year of a strong warm phase of ENSO (El Nino). In the Indian Ocean, this event produced cooler water in the area of Indonesia (blue and green) as the Western Pacific Warm Pool moved toward the central Pacific.
Response to a Warm-Phase ENSO
6. In 1997, in association with a strong warm-phase ENSO (El Nino off South America), the Western Pacific Warm Pool shifted eastward into the central Pacific. This also caused an eastward shift in the position of the ascending air, which in turn determines where the Pacific Walker cell meshes with the IOD.
7. This shift reduced the amount of rising air over Indonesia and moved the descending limb of the cell eastward, away from the coast of Africa (more over the Indian Ocean).
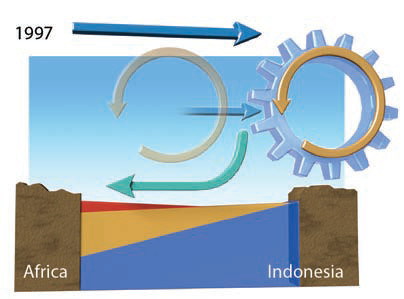
8. The weakened, displaced cell caused the southeast trade winds to strengthen and blow warmer surface waters to the west, piling them up along the coast of East Africa and limiting the amount of upwelling that normally characterizes this area. Cooler water was upwelled west of Indonesia to replace the water blown to the west. The configuration of warmer-than-normal waters in the west and cooler ones in the east, a characteristic of the El Nino phase, is termed a positive IOD.
Response to a Cold-Phase ENSO
9. During 1998, a cold-phase ENSO (La Nina) prevailed, bringing unusually warm waters to Australasia. The warm waters control the position of the ascending cell of the Indian Ocean dipole, which in turn affects conditions over the entire Indian Ocean.
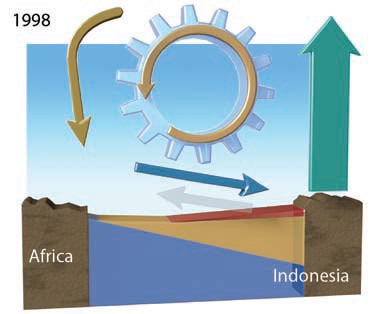
10. As the circulation cell migrated westward, descending air returned to the coast of Africa. The southeast trade winds weakened as they were combatted by the west-to-east surface Walker circulation. Winds pushed warmer water toward Indonesia, allowing colder water to upwell along the coast of equatorial East Africa, an area rich in marine life. This configuration, with cooler waters to the west and warmer ones in the east is termed a negative IOD.
What Is the North Atlantic Oscillation?
Air pressures in the North Atlantic are dominated by two semipermanent features — the Icelandic Low to the north and the Bermuda-Azores High to the south. Each pressure zone is stronger at some times than others, and the difference in pressure between the two varies as well. This variability in pressure difference between the two pressure centers is known as the North Atlantic Oscillation (NAO).
1. The Icelandic Low is a region of low atmospheric pressure that resides over the water of the North Atlantic Ocean, generally near Iceland. Circulation around the low is counterclockwise and inward.
2. The Bermuda-Azores High is a region of high pressure located farther south in the Atlantic, typically in the vicinity of the Azores islands west of Spain. Circulation around the high is clockwise and outward. The position of the high varies somewhat with time, but stays in this general vicinity.
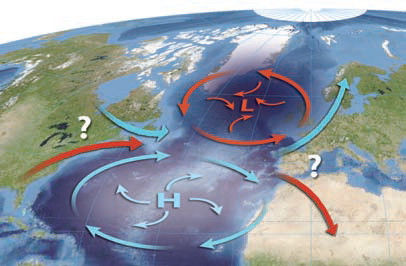
3. The opposite rotations of the two pressure areas act to funnel material, such as a storm, in from the west, accelerate it, and eject it out the other side. Material leaving the “funnel” on the east side can turn to the northeast if it is mostly under the influence of the counterclockwise, inward rotation of the low, or to the southeast if it is instead influenced by the clockwise and outward rotation of the high.
4. The NAO index is expressed quantitatively as the difference in pressure between the Bermuda-Azores High and the Icelandic Low. When the difference in pressure is greater than normal, the NAO is said to be in a positive phase. When the pressure difference is less than normal, the NAO is in its negative phase. Like the other indices, we commonly plot the index as a function of time to discern large-scale patterns of weather and climate.
Weather Impacts of a Positive NAO
5. The relative strength and positions of the high and low control the position and strength of the polar front jet stream over eastern North America, the storm tracks across the North Atlantic, and the trajectory of the jet stream and storms across northwestern Europe, the Mediterranean, and North Africa. This top map shows the typical winter impacts of a positive NAO, when there is a large pressure difference between the low and high.
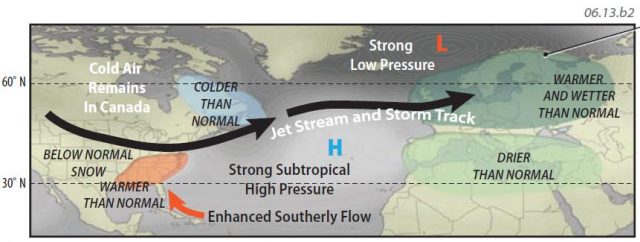
6. Northwest Europe and European Russia experience warmer, wetter winters, while southern Europe, North Africa, and the Middle East suffer drought in what is usually the wet season.
7. When the NAO index is positive, the polar front jet stream and associated storms are steered northward, leading to warmer winters in the northern U.S. and unusual tropical air over the Southeast.
Weather Impacts of a Negative NAO
8. A negative NAO index occurs when there is less pressure difference (i.e., less of a pressure gradient) between the high and low. The Bermuda-Azores High is not as strong and so is less able to block or guide storm systems compared to the way it does under a positive NAO. In the winter, the weakened high pressure allows the polar front jet stream and storm tracks to move southward, permitting the passage of cold Canadian air over the eastern U.S. and resulting in greater than normal snowfall. Once over the Atlantic, the jet stream and storm track continue in an eastward direction toward Europe and Africa.
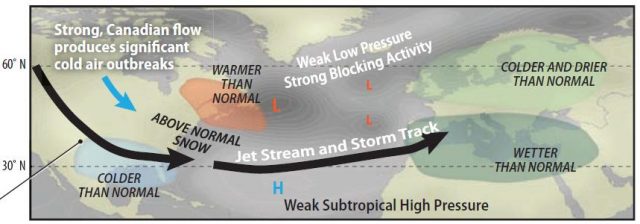
9. During a negative NAO, cold, dry continental air dominates Russia and northwest Europe, limiting the amount of clouds and precipitation. The lack of clouds enables a large loss in radiant heat, keeping the region cold.
10. A southerly position of the jet stream and storm track bring moist Atlantic air over southern Europe, the Mediterranean, and North Africa.
- How Does an El Niño Start and Stop?
- Do Impacts of ENSO Reach Beyond the Tropics?
- What Are the Phases of ENSO?