cartogram
ONE OF THE LIMITATIONS of the traditional paper map is that real world areas with large populations are usually small in physical size and therefore represented as small area units on a map. As such, traditional paper maps have tended to mask geographic patterns in small area units that are of importance and interest on the map. The cartogram was developed to overcome this challenge.
A cartogram is a map or diagram that depicts attributes of geographic objects in direct proportion to the area or length of the objects. In linear cartograms, the length (distance or travel time) of geographic objects is scaled in proportion to the attribute being mapped. Likewise, in area cartograms, the area of a geographic object is scaled in proportion to an attribute. For example, if an area cartogram uses the area of a country to depict the magnitude of its population (the attribute), then country A, with twice the population of country B, will be represented on a cartogram with an area twice that of country B. Since the cartogram does not represent geographic space, but alters the size of objects in proportion to an attribute, it is not considered a scaled map. As such, the cartogram does not always appear visually similar to a map.
Cartograms are of three types: noncontiguous, contiguous, and Dorling cartograms. Noncontiguous cartograms are the simplest and allow the geographic objects to be detached from their adjacent neighbors. This detachment permits the objects to expand or contract their area without distorting their natural shape.
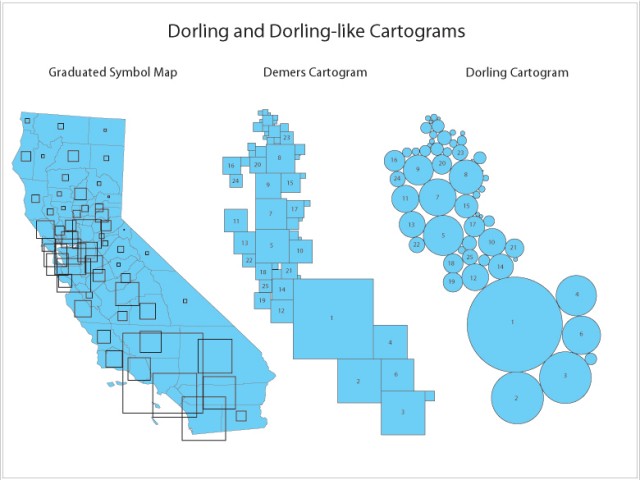
Contiguous cartograms are more difficult to construct because neighboring objects must remain in contact, resulting in a distortion of shape. In Dorling cartograms the geographic objects are replaced with a uniform nonoverlapping shape, such as a circle, where the area of the circle is proportional to the attribute being represented. Each cartogram type presents the attribute of geographic objects from a different perspective. Also, each type of cartogram requires a different level of effort from the reader to understand the structure and content of the information being communicated.
In addition to the three pure forms of cartograms, there exist pseudo-cartograms, or false cartograms. Pseudo-cartograms do not strictly follow certain cartogram rules. For example, instead of enlarging or shrinking objects directly, Waldo Tobler pioneered an approach where the distance connections between the objects are transferred to a reference grid such as latitude and longitude to maintain directional accuracy among the objects. But in so doing, extensive errors are created in the real object size. However, pseudo-cartograms are useful because they are regarded as an intermediate stage that is easily created by a computer and can be later modified by a cartographer toward the development of a pure continuous cartogram.
Initially, cartograms were constructed manually using traditional map-making tools and techniques. But this is a tedious and time-consuming process. Today, the cartogram construction process is accomplished predominantly by computer software programs. The usefulness of a cartogram lies in its ability to communicate and visualize data and information. The downside is that each map message will require the creation of a new cartogram, and during the cartogram creation process, data loss in inevitable. However, a well-designed cartogram can communicate information visually and make it much easier for the public and uninitiated reader to understand intended messages. As a scientific tool, cartograms facilitate the visualization and analysis of geographic patterns by clearly emphasizing attributes of interest.