How Do Insolation and Outgoing Radiation Vary Spatially?
FLOWS OF ENERGY into and out of Earth's system vary spatially, as a function of latitude, land or sea, cloud cover, and many other factors. The pattern of insolation also changes over several timescales, from daily rotation of the planet to the longer changes in season, causing spatial and temporal imbalances — zones of surplus energy and zones with an energy deficit, relative to the planetary average. These energy imbalances provide the driving force for global weather and climate.
How Does Insolation Vary Spatially?
Insolation striking the top of the atmosphere, when averaged over a year, shows a smooth gradient, from higher amounts over the equator to much lower amounts at the poles. A more complex pattern emerges if we examine how much insolation actually reaches the surface during the course of a year, as shown in the figure below.
1. At the broadest scale, latitude controls insolation. The highest amounts are in low latitudes, and the lowest amounts are near the poles. Purples on this globe are as low as 120 W/m2, whereas orange and red are more than 250 W/m2.
2. Although insolation is strong in the tropics it is reduced somewhat due to absorption, reflection, and scattering by the abundant clouds that characterize these same regions.
3. The highest values are in subtropical deserts.
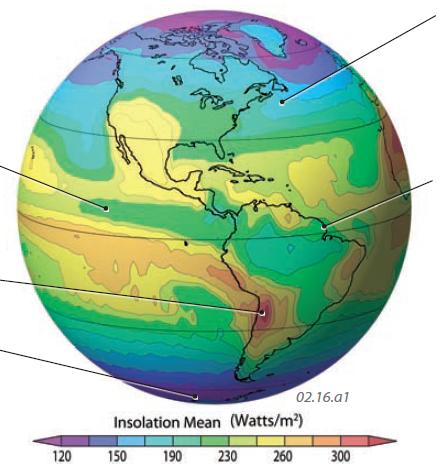
4. Universally low values mark the Antarctic and Arctic, which have days to months of total darkness. The lengthy summer days do not make up for the dark winters.
5. The mid-latitudes are between 30° and 60° latitude, between the lines shown on this globe. At these latitudes, there is a relatively steep gradient, with the amount of annual insolation decreasing toward the pole.
6. There is a band of somewhat lower insolation just north of the equator, indicating a region of frequent thick clouds, which raises the local albedo of these regions.
7. There is a marked contrast between the gradual variation in insolation patterns over oceans, versus the irregular patchwork of variations over continents. The more irregular character over land is because of its variable land covers and elevations, which in turn influence the albedo, cloud cover, and other factors.
How Does Outgoing Longwave Radiation Vary Spatially?
Using satellites, we can measure the amount of longwave radiation that leaves the Earth system (land, oceans, and atmosphere). The figure below shows the total amount of outgoing longwave radiation (OLR), averaged over an entire year. The picture for any single day is more complex, with more irregular weather-related patterns. The picture also varies in detail from hour to hour or week to week, because of local variations in storms, cloud cover, and other variables.
1. The quantity of energy emitted from an object depends on its surface temperature. Latitude strongly controls annual insolation, so it also controls larger patterns of both temperature and OLR.
2. The highest amounts of OLR are in the tropics, which receive more insolation than other regions. Some of this “extra” energy is directly returned as OLR from the surface and from the atmosphere.
3. The pattern of high OLR in the tropics is complicated over land, such as a zone of lower OLR along the western side of South America. This is due to a combination of a high mountain range (the Andes) and a cold ocean current (the Humboldt Current) along the west coast, both of which reduce the temperature, and reduced temperatures affect OLR.
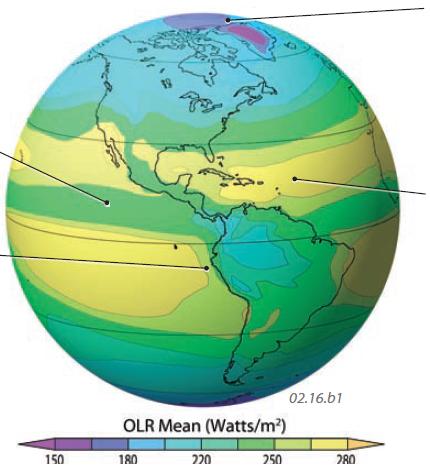
4. The Arctic and Antarctic differ from one another, although it is difficult to see from this perspective. The oceanic Arctic emits more OLR, appearing warmer, than the continental Antarctic. A similarly low OLR is associated with land in Greenland, compared to the adjacent ocean, which emits more OLR because it is warmer.
5. Conversely, some of the highest continental values of OLR are between 20° and 30° latitude, on either side of the equator. These are the global deserts, such as the Sahara in North Africa. In addition to having high temperatures, the absence of water vapor allows OLR to escape through the atmosphere.
6. The patterns in this globe and the one above change with the season, as the latitude of maximum insolation shifts north and south.
How Does the Balance Between Incoming and Outgoing Radiation Vary Spatially?
Tropical regions receive much more insolation than do mid-latitude or polar regions, and this results in an unequal distribution of energy as a function of latitude — tropical regions have more Sun-induced energy than the poles. Energy flows from regions of relative surplus toward regions with relative deficits.
Radiative Balances
1. This graph shows the average amount of insolation at the top of the atmosphere versus the amount of outgoing energy (OLR) emitted, as a function of latitude, from the equator on the left to the North Pole on the right. A graph constructed from the equator to the South Pole would be similar.
2. Like a bank account, the difference between incoming and outgoing radiation is a location's radiation balance. On average, regions near the equator, tropics, and subtropics receive more energy from insolation than they emit in OLR — they have a positive balance or a radiation surplus. The region of surplus extends as far north (and south) as about 35° latitude, well past the Tropics of Cancer and Capricorn. The amount of insolation and OLR barely change across the tropics (left part of the top graph).
3. Poleward of the tropics, insolation declines rapidly, while the amount of outgoing radiation decreases more gradually.
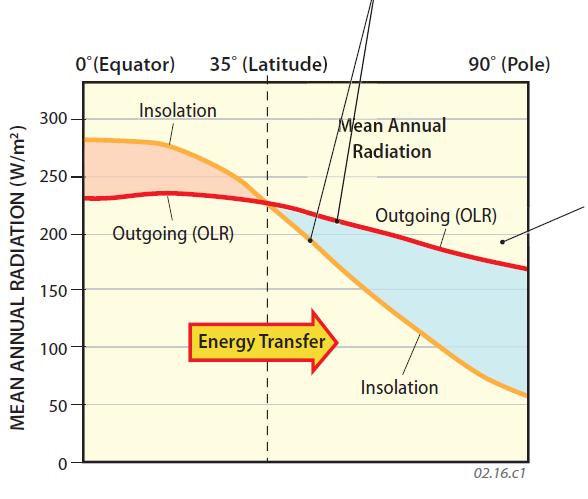
4. The two curves cross around 35° latitude, represented by the vertical dashed line. At this location, the amount of outgoing radiation (OLR) equals the amount of incoming radiation, on average — at this latitude, there is a radiation balance of zero.
5. Poleward of 35°, regions emit more OLR than the shortwave radiation that they receive from insolation — they have a radiation deficit. Insolation continues declining rapidly at mid latitudes, reaching very low values in the polar regions. The energy balance becomes increasingly negative toward the poles.
6. Energy is transferred from areas of surplus to those of deficit, toward the poles.
Large-Scale Patterns of Radiative Surplus and Deficit
7. This globe shows the mean annual radiation balance based on satellite observations. Orange, red, and dark pink represent zones of surplus, whereas yellow, green, and blue are regions of deficit. The white dotted lines show 35° N and 35° S. What patterns do you notice?
8. As expected, the regions with the highest energy surplus, depicted in red and orange, are concentrated along the equator, extending out across the tropics on both sides of the equator.
9. The patterns on land are locally more complex than the patterns in the ocean, suggesting the complicating influence of variations in elevation and the resulting complex patterns of clouds, snow, wind directions, etc.
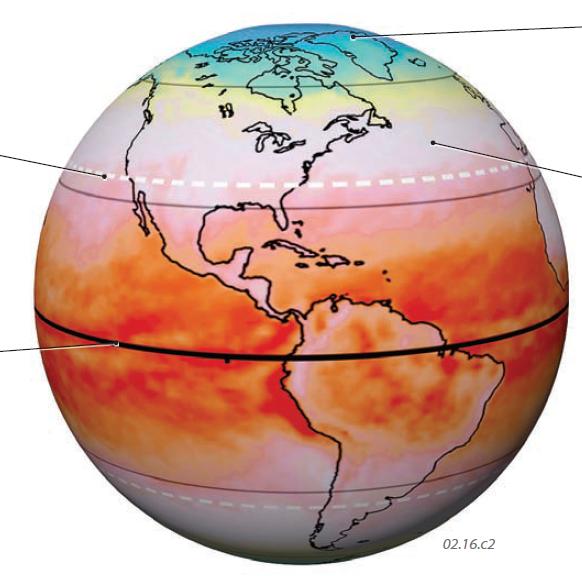
10. The regions with the most severe energy deficits are near the poles. These regions lose much more energy to space than they gain from low-angle sunlight during the summer, and they receive no insolation during the winter.
11. The mid-latitudes, between the tropics and the polar circles, exhibit a slight radiative deficit, represented here by a light pink color. They gain energy transferred poleward from the tropics.
12. More than half of the planet's surface area has an energy surplus, and less than half has an energy deficit. The total amount of surplus energy equals the amount of energy deficit, and the planet is in an overall energy balance. As we will explore later, the transfer of energy from areas of radiative surplus to those of deficit drive much of our wind patterns and weather.