What Are the Global Patterns of Temperature and Salinity?
THE OCEANS VARY IN SALINITY from place to place and with depth. Spatial variations are due to differences in the amount of evaporation and formation of ice, which increase salinity, versus the amount of precipitation, input from streams, and melting of ice, all of which add fresh water that dilutes the salinity. Also, saline waters are more dense than fresh water, so there are differences in salinity with depth in the oceans.
What Is the Observed Pattern of Sea-Surface Salinities?
The oceans vary in temperature and salinity, and therefore also in density, laterally across the surface and from shallower to greater depths. The maps below summarize the global variations in SST and surface salinity. Examine the patterns on each map and then compare the patterns between the maps, region by region.
1. This map, now familiar to you, shows sea-surface temperatures, with red and orange being warmest and blue being coolest. Note where the warmest seawater is located, and think about what implication this might have for salinity. Do you think this warm water will be more or less saline than waters that are somewhat cooler, like those shown in yellow on this map?
2. The dominant feature of global variations in SST is the equator-to-pole contrast arising from the supply of insolation and the amount of energy available to heat the water.
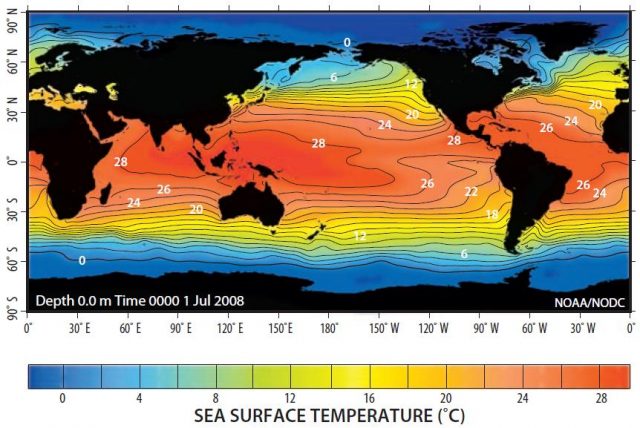
3. Where are the coldest waters located? Naturally, they are near the poles. Note the cold end of the temperature scale below the map, which shows that some of the coldest areas are at or even below freezing. We would expect ice to be present in these areas. The ice could be forming and increasing the salinity of the seawater left behind, or it could be melting and introducing fresh water into the sea, decreasing the salinity. We might predict that ice would influence salinity.
4. This map shows salinities of the ocean surface, with red areas having the highest salinities and blue and purple having the lowest. First, observe the main patterns. Then, think about how you might explain these patterns by considering the processes described on the previous two pages, such as the amount of evaporation and cloud cover. After you have done these, read on.
5. The lowest salinities, represented by the regions in blue and purple, are mostly at high latitudes, such as areas closer to the poles. We can largely explain these low salinities by high-latitude regions being cold, with low amounts of insolation, and therefore low amounts of evaporation. Note, however, that some areas of low salinities are well away from the poles. One low-salinity region is in the very warm water that is southeast of Asia; therefore, the warmest areas of the ocean are not necessarily those with the highest salinity.
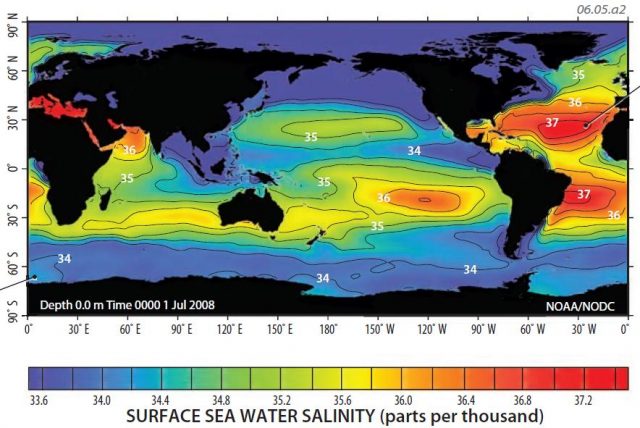
6. High salinities occur in the subtropics, coinciding with locations of the subtropical high pressures. These areas have relatively clear skies and intense sunlight, which together cause high rates of evaporation, and the subtropics have low amounts of precipitation and dilution. The Mediterranean is very saline because it experiences high evaporation rates and has a limited connection to the Atlantic, with few high-discharge rivers flowing into it. Also note some moderate-salinity water in the northern Atlantic Ocean, near Greenland.
7. Low salinities away from high latitudes occur (1) where large rivers, like the Mississippi, Amazon, and Ganges-Brahmaputra rivers, deliver fresh water to the sea, (2) where cold currents, like the California Current and Humboldt Current, bring less saline waters away from the pole, and (3) in areas of high precipitation, like west of Central America and in the previously mentioned warm-water area southeast of Asia. Find all of these areas on the map.
How Do Temperature and Salinity Vary with Depth?
The oceans also vary in temperature and salinity as a function of depth. Seawater is warmest near the surface, where it is warmed by the Sun. The distribution of salinity is similar, with the most saline waters near the surface, where there is evaporation. Salinity has more complex patterns too, because saline waters are more dense than less saline water and so they can sink. We present the temperature and salinity data in two pole-to-pole cross sections.
1. This pole-to-pole cross section (taken at 20° W longitude) shows Atlantic Ocean temperatures from the surface to the seafloor. Warmer surface waters overlie colder, deep ones. When this occurs, less dense water overlies more dense water, a highly stable arrangement.
2. Only at polar latitudes, both in the far north (right) and far south (left), are surface and deep ocean water temperatures similar. When shallow and deep waters are similar in temperature and density, they can mix more easily, bringing deep water up toward the surface and causing shallow water to sink. Such mixing of waters from different depths is called overturning or turnover.
3. This cross section shows salinity (measured in PSU) along the same line, from the North Pole on the right to the South Pole on the left. Examine the patterns on this cross section and compare it with the temperature cross section above. Predict which way some of the water is moving at depth.
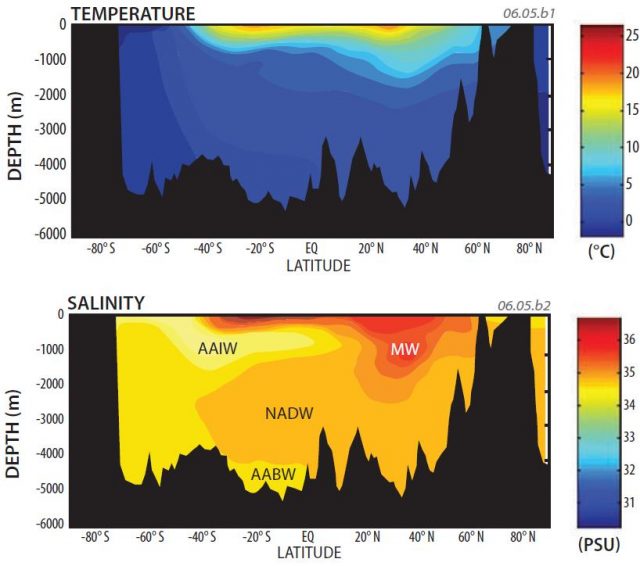
4. In this cross section, a tongue of less saline waters from Antarctica, called the Antarctic Intermediate Waters (AAIW), forms a wedge below saline waters near the surface with somewhat more saline waters at depth. Along the bottom are some moderately saline, very cold and dense waters known as Antarctic Bottom Waters (AABW).
5. In the upper part of the middle of the cross section is a relatively thin veneer of extremely saline waters that formed from evaporation and limited rainfall in the subtropics. A thicker batch of salinity at 40° N marks saline waters exiting the Mediterranean Sea (MW), which explains the increased temperatures at 30° N to 40° N.
6. Last, but not least, a key feature is an extensive tongue of saline polar waters that descends near Iceland near 60° N to 70° N and then extends well south of the equator as the North Atlantic Deep Waters (NADW). As we shall explore shortly, this flow of saline waters down and to the south has a major role in moderating the climate of our planet.
What Are the Regional Relationships Among Temperature, Salinity, and Density?
1. To explore how temperature, salinity, and density vary from region to region, this graph plots temperature on the vertical axis and salinity on the horizontal axis. Contours crossing the graph represent differences in density in parts per thousand, as calculated from the temperature and salinity. The yellow star represents the mean temperature and salinity of the world's oceans. Examine this graph and consider why a region plots where it does.
2. Equatorial waters are warm due to high insolation and are less saline than average seawater due to heavy tropical rainfall. Warm temperatures and low salinity produce low densities (i.e., numbers on the contours).
3. Mid-latitude waters are moderate in temperature and salinity. Compared to the average ocean, they are cooler because they receive less insolation than average, but less saline because precipitation generally exceeds evaporation.
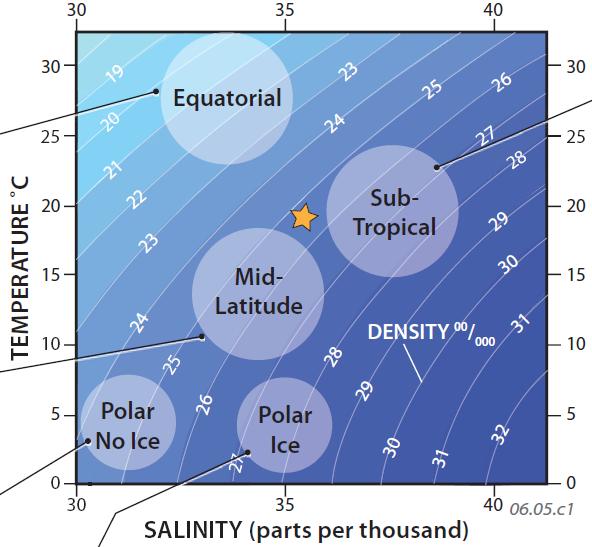
4. Ice-free polar regions, predictably, have relatively cold seawater. They are also slightly less saline due to lower amounts of insolation and associated evaporation at high latitudes.
5. In polar zones where sea ice is actively forming, ice removes some fresh water from sea water, leading to greater salinities.
6. Subtropical waters are cooler than equatorial ones, but more saline, because surface evaporation exceeds precipitation. The salinity in particular leads to higher densities (shown by curved lines) of these waters. The most saline waters in the world are in the subtropics, especially where an area of the sea is mostly surrounded by continents and has somewhat restricted interchange with the open ocean. Such very saline waters are in the Red Sea and Mediterranean Sea.
- What Causes Water to Rise or Sink?
- How Do Sea-Surface Temperatures Vary from Place to Place and Season to Season?
- What Is the Global Pattern of Surface Currents?