How Are Weather Forecasts Made?
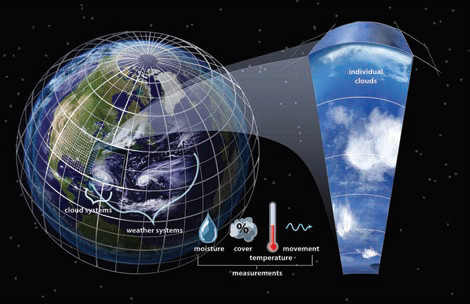
THREE INGREDIENTS ARE NECESSARY for weather — energy, motion (both horizontal and vertical), and atmospheric moisture. The physical processes, such as energy transformations during phase changes of water (between solid, liquid, and gaseous states) are well understood, but several problems limit accurate weather forecasting. First, the equations describing the various transformations across three-dimensional space are complicated, requiring the highest powered computers. Data that are input into the models are often inadequate in quantity and quality. Also, it is impossible to know all the initial boundary conditions or other complexities.
What Are the Sources of Data for Weather Forecasting Models?
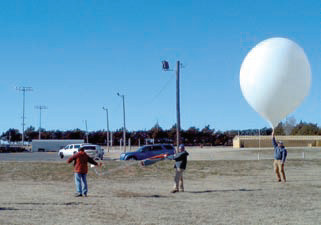
Airborne Instruments — Every 12 hours, weather balloons are launched synchronously at about 800 sites around the world. These balloons are equipped with computerized sensors that report the vertical profiles of temperature, pressure, humidity, wind speed and wind direction, and sometimes other data, like ozone concentrations. The balloon ascends until it eventually bursts above the 200 mb level, and the instrument floats down on a parachute, to be used again.
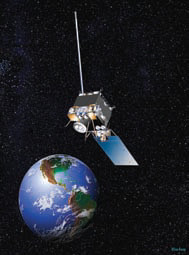
Satellite Data — provide estimates of temperature, humidity, wind speeds, and other variables. They may be the only data available for the oceans and other sparsely inhabited parts of the Earth. Some weather satellites trace paths around the world over periods of several hours, while others remain over the same location, following the Earth as it rotates on its axis.
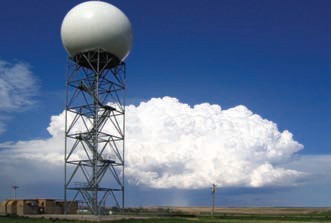
Radar — Meteorologists rely extensively on radar, some of which is collected from ground and some from satellites. Doppler radar stations emit microwaves that are reflected back to the receiver from water droplets. Differences in wave frequency reveal the direction of movement, both of the water droplets and of the circulation steering them.
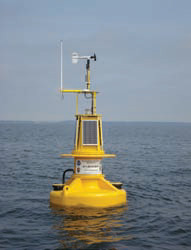
Marine Data — Some marine areas have moored buoys that measure air and sea temperature, pressure, wind speed and direction, and wave speed and height. Portable buoys and a variety of floating objects are used to track ocean currents, although similar data can be collected by satellites.
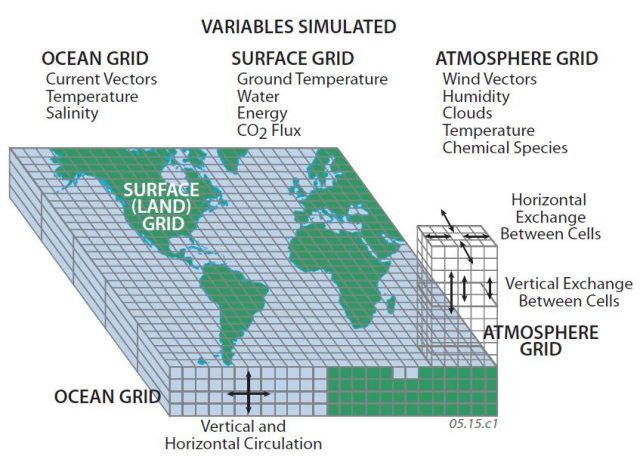
All of these data are reported telemetrically to a central receiving station in suburban Washington, D.C., for processing. The received data are first checked for obvious errors and to make sure the sensors are working correctly. After this first crucial step, data from the different sources are spatially averaged and interpolated to make the huge data sets a bit more manageable. For example, the atmosphere is commonly depicted as a series of points, each representing the center of a cube of air, with a three-dimensional array of virtual cubes encircling the Earth and stacked dozens high. The interpolated data are most accurate where derived from closely spaced, actual measurements, and much less accurate for regions or levels of the atmosphere with few actual measurements.
Upper-level data used to determine the value of the center point for cubes higher in the atmosphere are far less abundant than surface data, so the accuracy of the interpolation typically decreases upward. The smaller the cubes, the higher the spatial resolution, but smaller cubes also increase the computation time. Maps for various vertical levels, called analysis products (as opposed to forecast products used to predict weather) show the values of the interpolated data. These maps are produced for the U.S. by the National Weather Service and for the world by meteorologists affiliated with the World Meteorological Organization.
What Equations Are Used in Weather Forecasting Models?
All weather forecasting models are based on only seven equations. Three of the equations describe atmospheric movement and are manifestations of Newton's Laws of Motion. These equations represent velocity or acceleration in three dimensions — west-east, north-south, and up-down in the atmosphere.
A fourth equation accounts for density changes resulting from the piling up or spreading out of air in each cube. The fifth equation describes the rate of change of atmospheric moisture and accounts for changes of state of water in each cube. The sixth equation describes the rate of change of incoming energy (diabatic heating) from the Sun, the energy that powers all motion. Finally, the seventh equation is the Ideal Gas Law, which describes the relationship among temperature, pressure, and density in each cube, and how these intrinsic attributes change in response to all motions and all the other processes.
How Are the Input Data Used in Computer Models?
1. Once the data have been collected, checked for accuracy, and interpolated into a three-dimensional grid, like the one in the figure below, the next step is to use the data as inputs into models of how our world works. To do this, the variables at the center point of each cube are input into the seven equations. Each equation (except for the Ideal Gas Law) calculates a rate of change of the variables in that equation. For example, an equation might calculate how fast the atmospheric velocity changes (i.e., accelerates or decelerates) in an west-to-east or south-to-north direction. Or, we could model how fast atmospheric density or moisture changes due to some change in the environment. Each step in the model forecasts these rates of change for a relatively short interval of time (usually minutes). This is called the time step.
2. In this way, answers to questions we have about weather and climate come from solving the seven basic equations simultaneously at each centerpoint. A model takes into account the values of each variable within a cube and in adjacent cubes (including the ones above and below it), for the thousands of cubes. Then, the model generates a forecast of the atmospheric conditions, starting at some specific time.
3. To forecast hours or days into the future, a model produces a series of forecasts, each representing one short increment of time into the future. Each incremental step uses the previous step's forecast (i.e., the “answers” for each cube) as a starting input for the next forecast. Many iterations of the model are run in order to eventually generate forecasts for hours to days into the future.
4. Any inaccuracies in input data cause errors in the forecast from the start. Also, with each time increment, the forecast will not be 100% accurate, because of an incomplete understanding of the physics involved in exchanges between the atmosphere and the land or ocean surface, or because processes smaller than the grid are at work. Given the complexity of the weather forecasting problem, especially the diverse set of spatially varying parameters, it is amazing that forecasts are as accurate as they are.
How Meteorologists Design, Use, and Intervene in Models
Even though computer models make various types of calculations and forecasts, humans are needed to determine which model output is most trusted in a given situation. For example, a meteorologist's experience and intuition may tell her that — at a particular time of year in a particular type of meteorological setting — one model is more successful at predicting precipitation than another model. Since weather forecasts can have profound implications for people's lives, such as whether to evacuate or take shelter, it is important to keep a human “in the loop.”
Meteorologists determine what data and assumptions go into a model, and they design a model to answer a question at a specific temporal or spatial scale. Some models have shorter time steps (i.e., better temporal resolution) than others. This can be an advantage since a prediction is more likely to be accurate if it is made over a shorter time period. In addition, a poor temporal resolution could allow fast-forming weather systems to occur without being taken into account in subsequent calculations. Better temporal resolution, however, comes at the expense of computation time.
Likewise, models differ in their spatial resolution (including the number of vertical levels included), with finer resolution giving more precision, but requiring more computational power. The size of the area for which the forecast is generated is an important consideration. Modeling larger spatial domains gives more assurance that storm systems or other features will not creep into the area of interest undetected, but larger areas also require more computations.
Finally, some models express motion not in terms of what is happening at a series of three-dimensional gridpoints, but as a series of waves — these are called spectral models. They can be very accurate and may represent the “wave of the future” in weather forecasting models, particularly for longer forecasts.
In addition to collecting data, designing accurate data-collection strategies, and developing and interpreting models, atmospheric scientists research the physics and feedbacks involved in complex weather systems, with a goal of refining the models so that forecasts and other analyses are increasingly accurate.
These complex systems are generally more important in models for predicting long-term climatic changes than for predicting weather.