How Do We Use GIS to Explore Spatial Issues?
MAPS ARE USED FOR REPORTING OBSERVATIONS and making interpretations from previously collected observations, and they can also be analyzed to create new maps. Maps created from aerial photographs, satellite imagery, and field observations can be stored in computer databases called geographic information systems (GIS), where a variety of information can then be combined quickly and efficiently to examine relationships among the different features. For example, we might be interested in comparing the distribution of plant communities with the type of soil, average precipitation, and percentage of nights when it freezes. Modern geographic analysis using GIS is data-rich and computer-intensive, providing the clearest way to explore many types of spatial relationships.
What Are Geographic Information Systems?
The first step required to analyze geographic problems is to decide what key data sets are needed to best understand the issues. Then, maps, images, and data are imported into a GIS database. Maps, aerial photographs, and satellite images need to be matched to standard geographic coordinates, such as UTM. The process of taking an image or map and matching it to standard coordinates is called georeferencing or rectification.
Once data are in the GIS, we can overlay different maps to compare different data sets. We commonly call each map a GIS layer because in the GIS computer we can arrange the different maps (layers) one on top of another, as shown in the figure to the right. Examining multiple kinds of data in this way would be useful, for example, in selecting a site for some type of facility.
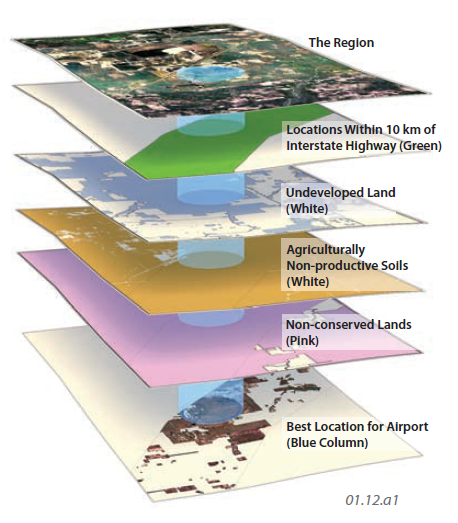
Suppose city planners want to find the best location for a new airport. They first need to determine what already exists in the region so they examine a satellite image or aerial photograph (the top layer in the GIS layers shown here). Priority is given to sites that are within 10 km of an interstate highway (second layer from top). The site must contain a large area of undeveloped land (third layer), does not have soil that could be productively farmed (fourth layer), is not designated as wetland (fifth layer), and other considerations, such as who owns the property and whether the site has unstable slopes and soils (not shown). Without a GIS, several individual maps would have to be compared by hand to determine the best possible sites. A GIS can store each of these maps digitally and allow the user to identify any locations that meet the specified criteria. The digital format also allows for easy updating, and inquiries can be run on the potential sites to glean further information, such as current land costs.
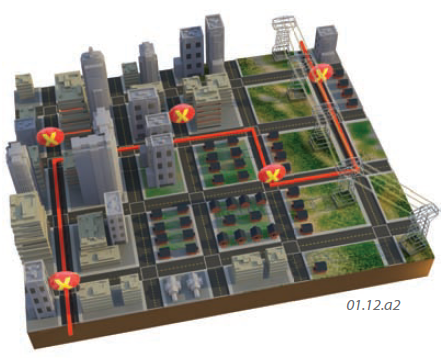
Another popular use of GIS is for route optimization. If you have ever used Google Maps® or a navigation system on your phone or in your car, you've made use of this feature of GIS. In the example below, GIS is used to show a route that minimizes the distance that a shipping company must travel to deliver packages to locations marked with an “X” on a given day. Similar inquiries can be used to optimize routes for garbage pickup, hurricane evacuation, or school bus stops.
The site selection and routing applications of GIS can be used together. For example, a power company may want to minimize the distance that power lines must be run, while still keeping the lines as far as possible from heavily populated and low-lying areas. Also, the power lines ideally are hidden from view as much as possible by local topography and forests.
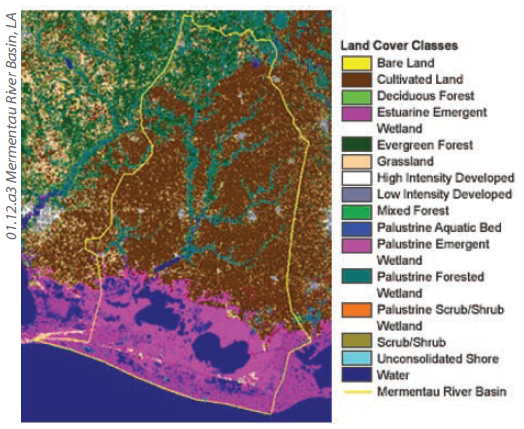
GIS can be used in combination with remote sensing to classify areas on images. This can be very useful in determining land use and land cover for environmental applications. In its simplest form, areas could be classified as being urban, forested, agricultural, undeveloped, or water. More elaborate classifications could be used to identify types of wetlands and forests or other important aspects.
Another key advantage of GIS is that it allows direct comparison of changes in an area over time, whether those changes are in land use, vegetation cover, population density, or some other variable. By comparing earlier or later images of the same area, rates of urban sprawl, deforestation, or wetland loss could be documented, allowing us to consider possible remedies in an informed manner.
What Kinds of Calculations Are Possible with GIS?
Spatial analysis is a cornerstone of geography, and GIS can evaluate the spatial distributions within the data, highlight correspondences among different variables, and automate the identification of properties of spatial distributions.
If the locations of observed features can be considered as points, such as stations that reported precipitation in the past 48 hours or sites in a stream where dissolved oxygen is low, physical geographers often want to know whether those features (1) occur in clusters, (2) are spaced approximately evenly apart (i.e., regular distribution), or (3) are distributed randomly across the landscape. Point-pattern analysis can answer this question objectively, and GIS can complete the geostatistical calculations automatically. Analysis proceeds on the principle of laying an imaginary grid over the study area and determining whether the object of interest is distributed significantly less
evenly (i.e., clustered) or more evenly (i.e., regular) across the grid cells than would be expected in a random distribution.
Types of Spatial Distributions
1. Geographers are interested in the distributions of objects, whether of plants or animals or the locations of gas stations. There are a number of different types of distributions, three of which are shown here. The name of each type conveys the overall character of the distribution, but there are usually exceptions (called outliers) to the general patterns.
2. Objects can have a clustered distribution, with objects tending to occur together rather than being dispersed widely apart. Point-pattern analysis would conclude that the trees on the left side of the diagram are clustered. We may conclude that individual trees prefer proximity to a feature present in only part of the area, such as next to ponds, streams, and other sources of water. In many cases, the explanation for a clustered distribution is not so obvious as in this case.
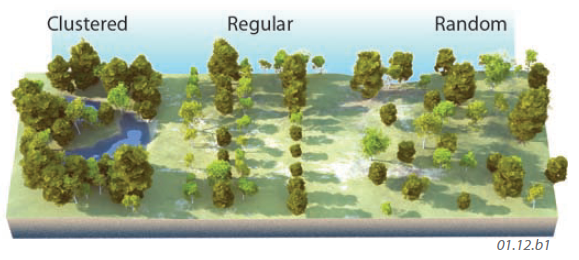
3. Objects can also have a more regular distribution, more or less evenly spaced apart and not spatially clustered. Point-pattern analysis would suggest a regular distribution of trees in this middle location. Perhaps individual trees, when away from lakes and streams, are more likely to survive if spread out as far as possible from other trees, increasing access to precipitation.
4. Objects can have random distribution, such as the trees on the right side of this figure. Some trees occur together, but not consistently. Point-pattern analysis indicates that the trees are neither clustered nor distributed regularly. The random arrangement fails to provide an obvious explanation of tree location.
Calculations on Lines and Polygons
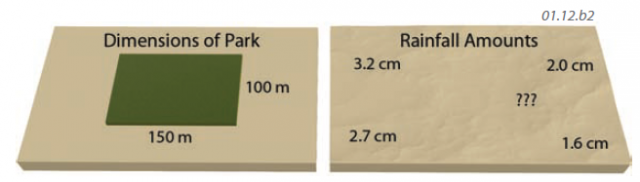
In addition to analyzing the distributions of points, GIS can calculate distances and angles between points, as when a navigation system calculates the distance to a destination. GIS can also be used to quantify the extent of areas, represented as polygons, such as the park shown here. GIS can calculate areas enclosed within polygons, identify the center of an irregularly shaped polygon, or calculate the perimeter of any area, like this park.
Spatial Interpolation
There are statistical methods of estimating a data value at any location if we have values for nearby locations. Such analysis, commonly called spatial interpolation, is done by comparing the location to known values of other points at different distances. For example, the amounts of rainfall, in centimeters, during a storm were measured at four weather stations, but we need to estimate the amount received in a nearby location that lacks a weather station. There are various statistical strategies, with names like kriging and inverse-distance methods. A common approach is to weigh the known values at other points by the distance from known points to the unknown point.
Identification of Buffer Zones
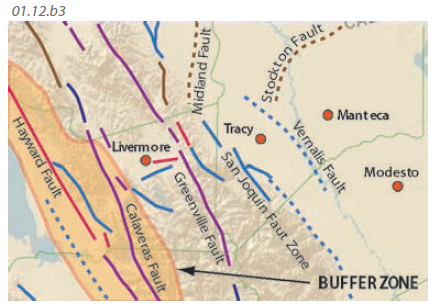
We may not want two things in close proximity, like a school next to earthquake faults that are most active. To solve such a problem, we need to compare the locations of schools with faults capable of causing earthquakes. GIS can contain all of these types of information, and can outline a buffer zone near such faults, within which school construction would be prohibited. Or a buffer zone may be drawn around a hurricane to indicate the zone of hurricaneforce winds. These buffered areas can then be overlain on other maps, such as one of population density, to identify the number of people whose homes are affected by the hurricane.
- How Do We Use Global Positioning Systems and Remote Sensing?
- How Do We Use Maps and Photographs?
- How Do Map Projections Influence the Portrayal of Spatial Data?
- What Are Some Other Coordinate Systems?
- What Do Latitude and Longitude Indicate?
- How Do We Depict Earth’s Surface?
- How Do Earth’s Four Spheres Interact?
- What Are Some Important Earth Cycles?
- How Do Natural Systems Operate?