Map Projections
The problem of how to best display the Earth's surface has puzzled cartographers, or mapmakers, throughout history. The oldest maps were limited by a lack of knowledge of the world, rather than by difficulties caused by the Earth's curvature. They tended to represent political or religious views rather than geographic reality. Ancient Greek maps from the sixth century B.C. show the world as an island, with Greece at its center, while medieval maps from the fourteenth century placed Jerusalem at the focus.
But by the fifteenth century, ocean-faring explorers such as Columbus and Magellan were extending the reaches of the known world. These voyagers took mapmakers with them to record the new lands that they discovered, and navigation charts were highly valued. Mapmakers, who now had a great deal of information about the world to set down, were forced to tackle the difficulty of representing the curved surface of the Earth on a flat page.
One of the earliest attempts to tackle the curvature problem for large-scale maps was made by the Belgian cartographer, Gerardus Mercator, in the sixteenth century, and it is still used today. A number of other systems, or map projections, have been developed to translate the curved geographic grid to a flat one. We will concentrate on the three most useful types, including Mercator's. Each has its own advantages and drawbacks. You can read more about maps and map projections in the introductory chapter.
POLAR PROJECTION
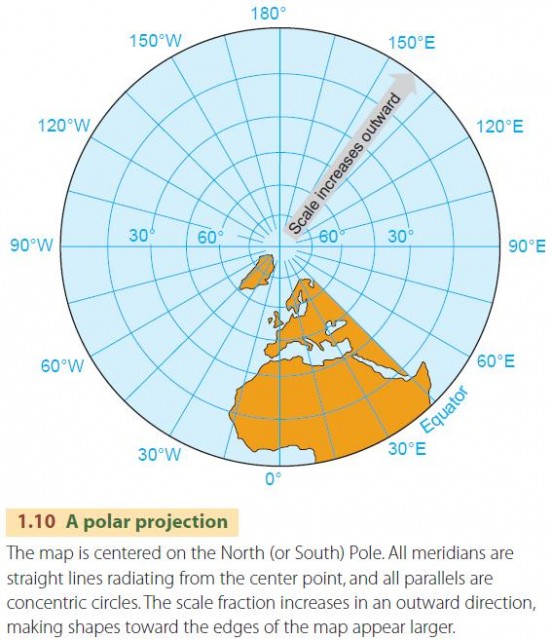
The polar projection (Figure 1.10 ) is normally centered on either the North or the South Pole. Meridians are straight lines radiating outward from the pole, and parallels are nested circles centered on the pole. The map is usually cut off to show only one hemisphere so that the Equator forms the outer edge of the map. Because the intersections of the parallels with the meridians always form true right angles, this projection shows the true shapes of all small areas. That is, the shape of a small island would always be shown correctly, no matter where it appeared on the map. However, because the scale fraction increases in an outward direction, the island would look larger toward the edge of the map than near the center.

MERCATOR PROJECTION
In the Mercator projection , the meridians form a rectangular grid of straight vertical lines, while the parallels form straight horizontal lines. The meridians are evenly spaced, but the spacing between parallels increases at higher latitude so that the spacing at 60° is double that at the Equator. As the map reaches closer to the poles, the spacing increases so much that the map must be cut off at some arbitrary parallel, such as 80° N. This change of scale enlarges features near the pole.
The Mercator projection has several special properties. Mercator's goal was to create a map that sailors could use to determine their course. A straight line drawn anywhere on his map gives you a line of constant compass direction. So a navigator can simply draw a line between any two points on the map and measure the bearing, or direction angle of the line, with respect to a nearby meridian on the map. Since the meridian is a true north-south line, the angle will give the compass bearing to be followed. Once aimed in that compass direction, a ship or an airplane can be held to the same compass bearing to reach the final point or destination.
But this line does not necessarily follow the shortest actual distance between two points, which we can easily plot out on a globe. We have to be careful—Mercator's map can falsely make the shortest distance between two points seem much longer than the compass line joining them.
Because the Mercator projection shows the true compass direction of any straight line on the map, it is used to show many types of straight-line features. Among these features are flow lines of winds and ocean currents, directions of crustal features (such as chains of volcanoes), and lines of equal values, such as lines of equal air temperature or equal air pressure. That's why the Mercator projection is chosen for maps of temperatures, winds, and pressures.
The Mercator projection shows a line of constant compass bearing as a straight line and so is used to display directional features such as wind direction.
WINKEL TRIPEL PROJECTION
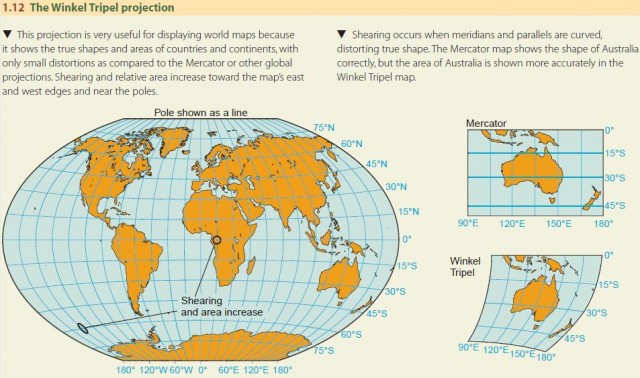
The Winkel Tripel projection (Figure 1.12 ) is named after its inventor, Oswald Winkel (1873–1953). The German word tripel is translated as “triplet” and refers to the property that the projection minimizes the sum of distortions to area, distance, and direction. The projection has parallels that are nearly straight, curving slightly toward the edges of the map. The meridians are increasingly curved with distance from the central meridian. Compared to the Mercator projection, we can see two major differences. In the Mercator map, the shapes of coastlines and countries are shown correctly, but their areas increase toward the poles. That is, the Mercator map is conformal but not equal-area. In the Winkel Tripel map, the shapes are somewhat distorted by shearing away from the central meridian and toward the poles. However, the areas of continents and countries are shown much more accurately. Only in the polar regions near the east and west edges of the map do areas grow significantly with latitude.

Because it shows areas and shapes with only a small amount of distortion, the Winkel Tripel projection is well suited to displaying global data. It is an ideal choice for world maps showing the world's climate, soils, and vegetation, and we use it in many places in this book.
GEOGRAPHIC INFORMATION SYSTEMS
Maps are in wide use today for many applications as a simple and an efficient way of compiling and storing spatial information. However, in the past two decades, maps are being supplemented by more powerful computer-based methods for acquiring, storing, processing, analyzing, and outputting spatial data. These are contained within geographic information systems (GISs). Tools in Physical Geography in our Introduction, presents some basic concepts of geographic information systems and how they work.