How Do Sea-Surface Temperatures Vary from Place to Place and Season to Season?
Average Sea-Surface Temperatures
1. These two globes both show SST averaged over the entire year and over several decades. Red and orange represent the warmest temperatures, purple and blue indicate the coldest temperatures, and green and yellow show intermediate temperatures.
2. Observe the global patterns and propose possible explanations based on how insolation varies from place to place. Then, examine the smaller patterns in the context of ocean currents (their position, direction of motion, and warm-versuscold character). After you have done this for both globes, read the associated text.
3. The most obvious pattern in the SST data, not surprisingly, is the large temperature change between low latitudes and polar regions. Polar regions are green, blue, and purple (from cold to coldest) on this globe — they are the coldest seas on Earth.
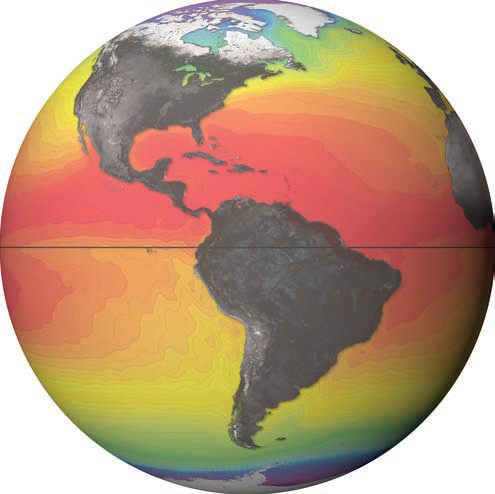
4. Note, however, that the warmest seas (in red) are not necessarily along the equator. If you expected the equator to be warmest, how could you explain this apparent discrepancy? Part of the explanation is that seas at the equator are overlain by rising air and so commonly have cloud cover that reflects some insolation. Also, some of the warmest seas are in the subtropics, where descending air dries out the surface, limiting cloud cover and permitting more sunlight to reach the sea.
5. An aspect to consider is whether an area of sea has a wide-open connection with open ocean. If so, that water can mix with or move to parts of the ocean where the waters are deeper and colder. On this globe, the warmest waters are in the relatively shallow Caribbean Sea and Gulf of Mexico, areas whose connection with the Atlantic Ocean is somewhat hindered by the many islands and peninsulas, so the Sun-warmed water mostly remains in those regions.
![]()
6. This globe shows most of the Indian Ocean (on the left) and about half of the Pacific Ocean (on the right). What patterns do you observe on this side of the globe, and what are some differences between this side and the other side of the planet, as shown in the top globe?
7. The semi-enclosed seas between the mainland of southeastern Asia and the islands of Indonesia and the Philippines are relatively warm, as is the Indian Ocean. As discussed later in this chapter, SST in this region, while always warm, can vary somewhat in response to an important ocean oscillation called the El Nino-Southern Oscillation, or ENSO for short. More on this important oscillation later.
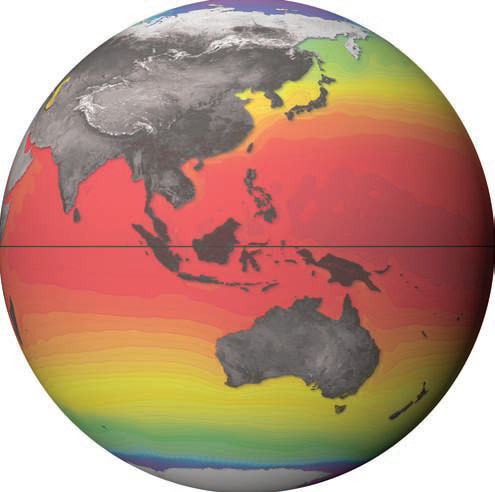
8. Patterns are more regular in the middle of the Pacific Ocean, away from the complicating effects of continents, which influence weather patterns and steer ocean currents along their coasts. The SST data form bands of colors that mostly follow along lines of similar latitude. The patterns are most complicated closer to the continents, such as near Japan.
9. The southern parts of the Indian Ocean and Pacific Ocean have similar, latitude-parallel gradations. Again, this pattern largely reflects the lack of complicating landmasses. Only the southernmost tip of South America (not shown), Tasmania (the island south of mainland Australia), and the South Island of New Zealand extend south of 40° S latitude. Between these places and Antarctica, the ocean continues unimpeded.
January Sea-Surface Temperatures
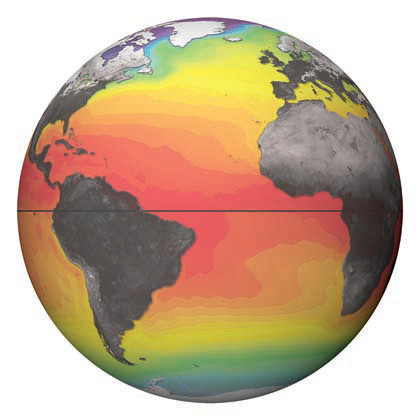
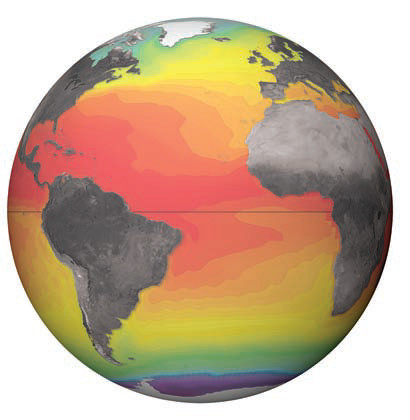
10. These two globes focus on the Atlantic Ocean. The left globe shows average SST for January, which is winter in the Northern Hemisphere but summer in the Southern Hemisphere. The right globe shows the same data for July. Observe the main patterns and compare the two globes.
11. In January, the colors of SST shift slightly but noticeably to the south, following the shift of maximum insolation as summer temperatures increase in the Southern Hemisphere. Also, whichever hemisphere is having summer experiences an overall expansion of warm SST.
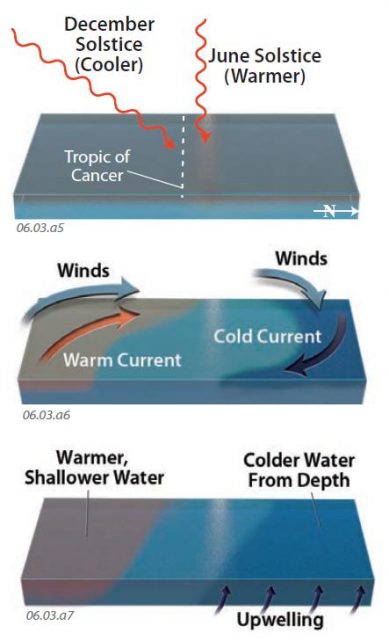
12. In January (the southern summer), the waters around Antarctica are not as cold as they are in July (the southern winter; the right globe). The opposite pattern occurs near the North Pole — waters there are colder in January, the northern winter, than during July, the northern summer.
July Sea-Surface Temperatures
13. Compare the patterns of SST on the two sides of the ocean. On the western side of the ocean, next to the Americas, warm waters spread relatively far to the north and south, away from the equator. This larger expanse of warm waters reveals the effects of ocean currents, like the Gulf Stream, moving warm water away from the equator, along the eastern coasts of North and South America. Warm waters of the Gulf Stream continue toward Europe.
14. Compare this with the pattern on the eastern side of the ocean, adjacent to Europe and Africa. Here, relatively cooler waters reach farther toward the equator. This pattern is especially obvious along the west coast of southern Africa, where the north-flowing Benguela Current brings cold water northward along the coast. A similar current, the Canary Current, brings cold water south along the coast of northwestern Africa. As a result of the opposite flows on the east versus west sides of the Atlantic Ocean, the width of warm water is much less near Africa than it is near South America and the Caribbean Sea.
Factors Influencing Sea-Surface Temperatures
15. From the four SST globes on these pages, the main pattern that emerges is the strong correlation of warm waters to low latitude. Between the tropics, the overhead rays of the Sun strongly heat the oceans, especially during summer for that hemisphere. Much less solar heating occurs near the pole; none for much of the winter.
16. Another influence is ocean currents, such as the Gulf Stream, which mostly move warm water away from the equator on the western side of oceans from about 20° to 50° north and south. In contrast, cold currents flow toward the equator on the eastern sides of oceans, as occurs with the Benguela Current off Africa and the Humboldt Current along the western side of South America. Currents largely reflect regional wind patterns.
17. A third important factor is the flow of cold, deep waters toward the surface, or upwelling. Cold-water upwelling occurs along the California coast, in the northern Pacific, off the western coast of South America, and in other places. This draws deeper water upward near the coast to replace the surface water blown offshore. Upwelling leaves only a subtle imprint on global temperature maps, but it strongly influences the biological productivity of the ocean and the activities in many coastal communities.
18. SST can greatly affect adjacent land. This photograph shows desert along the western coast of South Africa with the Atlantic Ocean in the distance. The dryness is partly due to the cold, stabilizing Benguela Current offshore and to prevailing winds that blow offshore.