What Happens When Air Rises or Sinks?
THE ATMOSPHERE IS A DYNAMIC ENVIRONMENT, with upward, downward, and sideways motion. What happens to air that rises and encounters different temperatures and pressures? What happens when air sinks? The vertical motions of air cause clouds, precipitation, and many other weather phenomena.
At What Rate Does an Air Parcel Cool As It Rises?
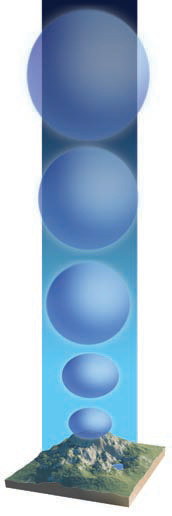
To explore the vertical motions of air, it is useful to track what happens to a discrete mass of air, called a parcel (used in the same way we refer to a lot of subdivided land as a “land parcel”). As we might expect, air changes temperature as it rises or sinks, largely in response to changes in air pressure and volume that accompany vertical motions through the air. Let's examine what happens as we follow a rising parcel of air, beginning with text at the bottom left (number 1).
1. If the parcel of air starts near the ground, its volume is confined by the weight of the overlying atmosphere, which exerts significant pressure. If the air begins rising, there is less air on top, which results in a decrease in air pressure.
2. As the air rises higher, the pressure continues to decrease. If the parcel does not acquire or lose additional energy with its surroundings, then the decrease in pressure is accompanied by (1) an increase in volume (as shown by the increasing size of the air parcel), and (2) a decrease in temperature as molecules become more widely spaced.
3. When there is no energy exchanged between the parcel and its surroundings, as in the case shown here, the process is said to be adiabatic. When such an exchange does occur, the process is diabatic. Increasing insolation of the surface as noon approaches is an example of diabatic heating.
4. If the rising motion can be assumed to be adiabatic, we can calculate how much a rising air parcel cools for a given rise in elevation, a rate called the lapse rate. Lapse rate is in units of degrees per vertical distance, usually in C°/km.
5. This graph plots the lapse rate for air that is rising adiabatically and remains unsaturated. The lapse rate is calculated simply as the change in temperature for the change in height, and reported as a ratio (C°/km). In the case shown here, the air cools 10 C° in one kilometer, or 10 C°/km.
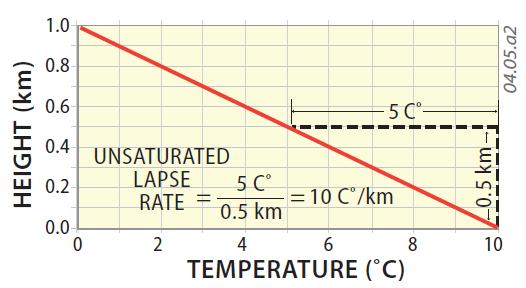
6. If any parcel of air rises adiabatically and does not become saturated during its ascent, it always cools at 10 C°/km. This constant lapse rate, called the unsaturated adiabatic lapse rate, applies everywhere adiabatically rising air remains unsaturated. By convention, positive lapse rates are for temperatures that cool with height, as shown by the orange line on the graph above.
7. If a parcel descends adiabatically, it warms at the same rate that it cooled on ascent — 10 C°/km. An adiabatically descending parcel of air will remain unsaturated, because the slightest bit of warming will increase the water-vapor capacity and therefore decrease the relative humidity. If the relative humidity is below 100%, the air is unsaturated.
How Much Does a Saturated Air Parcel Cool as It Rises?
1. A different situation occurs if the atmosphere is saturated. As a saturated parcel of air rises, the cooling decreases the water-vapor capacity of the air and, since the air is already saturated, the moisture must come out of the vapor via condensation, freezing, or deposition, as illustrated in the diagram below.
2. As water vapor molecules condense, they release latent heat that warms the local environment. This warming counteracts some of the cooling caused by the expansion of the parcel during adiabatic ascent. As a result, a rising parcel of saturated air cannot cool as much with increasing height as does unsaturated air. The lapse rate for saturated air will be less than the unsaturated adiabatic lapse rate.
3. The rate at which saturated air cools with adiabatic ascent is called the saturated adiabatic lapse rate. This rate depends on temperature because at higher temperatures more water vapor is available for condensation, freezing, or deposition. The figure below plots unsaturated adiabatic lapse rate in red and the saturated adiabatic lapse rate in blue, for different starting temperatures on the surface (on the bottom of the graph).
4. The slope of the lapse rate for unsaturated air (red lines) remains the same, regardless of starting temperature. The lapse rates for saturated air (blue lines), however, vary for different temperatures, as reflected by different slopes of the blue lines.
5. For any starting temperature, the blue line (saturated lapse rates) consistently plots to the right of the red line (unsaturated rate). This means that rising unsaturated air cools at a faster rate than saturated air (which is warmed by latent heat).
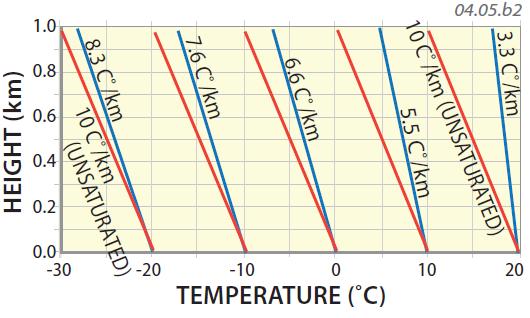
6. Note that the slopes for the unsaturated and saturated air are only slightly different for low temperatures (not much water vapor), but become more different at higher temperatures (more water vapor). This means that with increasing starting temperatures (farther right on the graph), warmer saturated air parcels cool less with height.
What Is the Lapse Rate of Air Adjacent to a Rising Air Parcel?
Air adjacent to a rising parcel of air can have a totally different lapse rate than the rising air, and these rates can vary significantly from day to day and place to place, depending on the local weather, climatic setting, and other factors.
1. The temperature change with height for air surrounding the adiabatically moving air parcel is known as the environmental lapse rate. The environmental lapse rate can be quite variable. On this graph, each green line represents the environmental lapse rate under certain atmospheric conditions. The different lapse rates are expressed as different slopes (inclination of the lines). When dealing with lapse rates, physical geographers call a lapse rate “steep” if the parcel cools a lot with height (as with the left line), even though that line does not look steep on this kind of graph. An environmental lapse rate is for air that is not rising or sinking, but instead represents the ambient conditions.
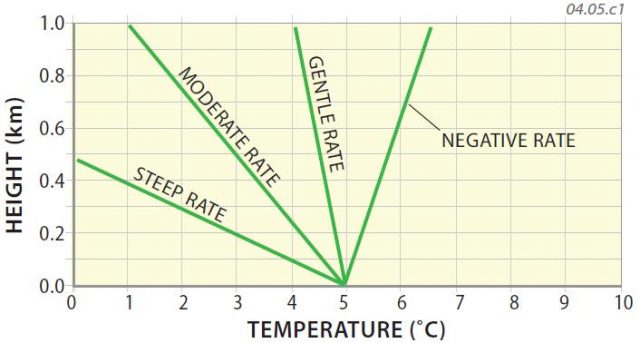
2. The left line has the steepest environmental lapse rate. The air temperature starts at 5°C at the surface but decreases 5 degrees (Celsius) by a height of 0.5 km. This yields an environmental lapse rate of 5 C°/0.5 km, or 10 C°/km. For this graph, the left line has the steepest lapse rate — its temperature cools the most rapidly with height.
3. The second line from the left has a moderate (less steep) lapse rate. For this lapse rate, temperature decreases more slowly upward in the atmosphere. The air is 5°C at the surface, but temperatures cool to 1°C by one kilometer higher. The change in temperature is therefore 4 C° between the surface and one kilometer in altitude, yielding an environmental lapse rate of 4 C°/km.
4. The third line (gentle rate) represents an even more gentle lapse rate. This air starts at 5°C at the surface, but the temperature only decreases to 4°C one kilometer higher in the air. This equates to an environmental lapse rate of 1 C°/km. The gradual nature of this change is why this type of rate is called a gentle lapse rate (even though the line looks steep on this graph).
5. The rightmost line has a negative lapse rate. It depicts a situation where temperature increases with increasing height. In such situations the environmental lapse rate is said to be negative because the temperature cools negatively (i.e., warms) with increasing height. A situation with a negative environmental lapse rate is called a temperature inversion.
What Do the Different Types of Lapse Rates Indicate About the Stability of Air?
The three types of lapse rates — unsaturated adiabatic lapse rate, saturated adiabatic lapse rate, and environmental lapse rate — each indicate something about conditions in the atmosphere. By comparing the three types of lapse rates, we can predict whether air will rise, sink, or not move vertically. That is, we can tell how stable the air mass is.
1. This graph compares different types of lapse rates for an adiabatically moving air parcel that starts from the surface at 10°C. The unsaturated adiabatic lapse rate is shown by the red line, and the saturated adiabatic lapse rate is depicted by the blue line. In green are three different environmental lapse rates with varying steepness.
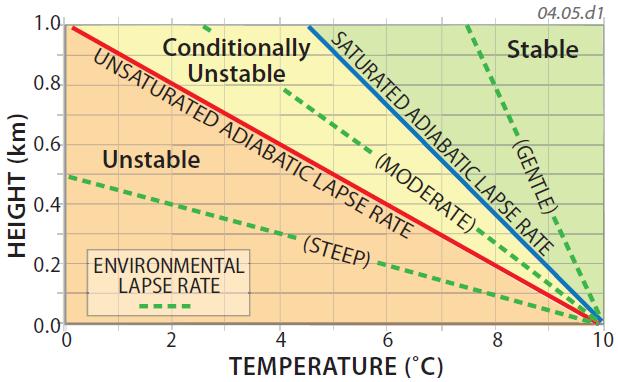
2. The green line in the lower left part of the graph has a steep environmental lapse rate, steeper than either the unsaturated or saturated lapse rates. If an air parcel starts to rise, it changes temperature according to one of the adiabatic lapse rates (red line or blue line, depending on whether it is unsaturated or saturated). Once either type of air has risen even a small amount, it will be warmer and less dense than the surrounding environment at a given height, so it will tend to continue rising. This will occur for either unsaturated or saturated adiabatically rising air if the environmental lapse rate falls within the orange region on this graph. In such situations, any rising air parcel will remain warmer than its surroundings and so will tend to continue rising, producing conditions that are called unstable (where air is rising).
3. A different situation occurs if the environmental lapse rate is moderate (the middle green line), plotting between the unsaturated and saturated lapse rates. In this case, if the adiabatically rising air is saturated (blue line), it will remain warmer than its surroundings (green line) and will tend to continue rising. If it is unsaturated, however, it will become cooler than its surroundings (green line is to the right of the red line in this case) and tend to stop rising. For this reason, the situation represented by the yellow area is termed conditionally unstable. In this situation, the addition of moisture to the air increases the likelihood for rising motions and other unstable conditions.
4. The rightmost green line represents a gentle environmental lapse rate, where the air cools relatively slowly with increasing height. As a result, an adiabatically rising air parcel (shown by the red or blue lines) would be cooler than the surrounding environment. In this case, the air parcel would cease rising because it is cooler and has a higher density than the surrounding air. At any given height, it will more likely sink, a condition known as a stable atmosphere. This will happen any time the environmental lapse rate is more gentle than the saturated rate (the green-shaded area). If the environmental lapse rate is negative (sloping up to the right), it forms a temperature inversion — a very stable atmospheric setting.