What Is the Dew Point?
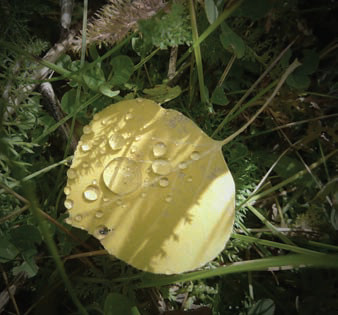
ANOTHER USEFUL MEASURE OF HUMIDITY is the dew point, the temperature to which a volume of air must be cooled to become saturated with water vapor. If the air temperature is at the dew point, the air is so saturated with water vapor that vapor begins to condense as drops of liquid water, such as drops in clouds or rain, or as water drops (dew) on solid surfaces. When you wake in the morning and everything outside is covered with moisture (dew), it signifies very humid air and that night-time temperatures cooled to the dew point.
How Is the Dew Point Expressed?
Dew is expressed as drops of liquid water that condense out of the atmosphere and onto plants, rocks, walls, or any solid surface. It typically forms at night, in response to the air cooling. If temperatures are at or below freezing, earlier formed drops of dew can freeze or ice can form directly from the air (deposition). In any case, drops of dew or crystals of ice disappear rapidly once the Sun rises and air temperatures begin to climb.
To explore the formation of dew, examine the sealed glass container on the left. It contains liquid water and water vapor (represented as blue dots). The container is warm enough that all the available water vapor can exist in the air without condensing — that is, the air is unsaturated.
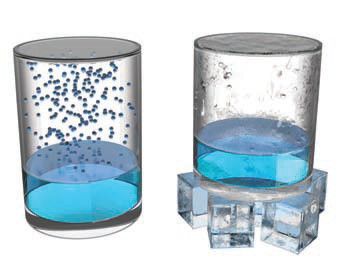
If we cool that same container with ice cubes, the temperature of the water and air will decrease. Recall that cold air has lower water-vapor capacity than warm air, so as the air cools it moves closer to saturation. At some temperature, the cooled air reaches saturation and can no longer allow so much vapor to exist in it. As a result, the water begins to condense as drops on the inside of the container, forming dew. As we know from our experience with cans or glasses of an icy beverage, drops of dew can also form on the outside of the container, especially if the surrounding air has high humidity.
What Is the Dew-Point Temperature?
1. To better visualize why cooling can cause the formation of dew, we return to a familiar graph, one that plots vapor pressure (e) versus temperature. The curved blue line marks conditions where air is saturated in water vapor; it is labeled as es, where the s indicates saturation.
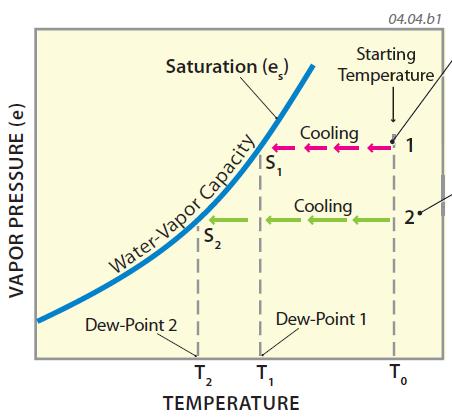
2. We begin with an air mass at a certain temperature (T0) and vapor pressure, marked as position 1, well within the unsaturated field of the graph. As this air cools, its position on the graph moves horizontally to the left (temperature is changing but vapor pressure is not), as indicated by the reddish arrows. It cools until it reaches saturation at position S1, at which point the air has a relative humidity of 100%. The temperature at which saturation occurs is the dew-point temperature and can be read from the graph by drawing a vertical line down from S1 to the temperature axis (T1).
3. A second air mass, at position 2, starts at the same temperature (T0) but has less water vapor in it (lower vapor pressure) than does air mass 1. If the air cools, as indicated by the green arrows pointing to the left, it also approaches the saturation curve. In order to reach saturation (at point S2), however, it has to cool more than air mass 1. Air mass 2 has less water vapor than air mass 1, and as a result has a lower dew-point temperature (T2).
4. To generalize, humid air at a given temperature has a higher dew-point temperature than does less humid air at the same temperature. If air is very humid, for example with a relative humidity of 80% to 90%, it may need to cool only a few degrees to reach its dew point. In contrast, air that is very dry (like the 5% to 10% relative humidities common in the Mojave Desert in California) has to cool significantly to reach its dew point, and on most nights does not.
5. The difference between current air temperature and the dew-point temperature is known as the dew-point depression. A large dew-point depression indicates that a large temperature drop is required to reach saturation. Thus, large dew-point depressions suggest dry air and small dew-point depressions suggest humid air so that only a minor drop in temperature will cause saturation. Dew-point depression is used in some agricultural and forestry applications and tells us how much temperatures might drop overnight, since air temperatures at night generally do not cool much below the afternoon's dew point.
6. Using dew-point temperature as an index of moisture overcomes most of the difficulties of using relative humidity, because dew-point temperature does not change as much through the course of a “normal” day as relative humidity does. In the Arizona desert, weather forecasters use dew-point readings to determine the official start of the summer monsoon. If the dew-point temperature is 55°F or higher for three straight days, summer rains and thunderstorms associated with the monsoon are likely.
Which Parts of the U.S. Have the Highest and Lowest Dew Points?
Dew-point temperature is an important measure of the humidity of air, as well as a predictor of dew and precipitation. The maps below show average monthly dew-point temperatures and air temperatures across the conterminous U.S. for January and July. Blue colors represent low (cold) dew-point temperatures, whereas orange and red indicate high dew-point temperatures. While observing the maps, identify areas that are unusually high or low and consider possible explanations for the patterns you observe. Find the values for the area where you live or would like to visit and think about how this relates to the climate there and how humid it feels at different times of the year.
January
1. Extremely low dew-point temperatures, as characterize the northern states in January, generally mean that the air is so dry that clouds do not form readily. Without cloud cover, night-time radiational cooling is intense, making January temperatures even more frigid.
2. Topography, such as mountain ranges in western North America, block moisture from penetrating to some regions, leading to low dew-point temperatures in the desert Southwest.
3. This map shows normal January air temperatures, averaged over the entire month. The warmest areas are in the Southwest and South Florida.
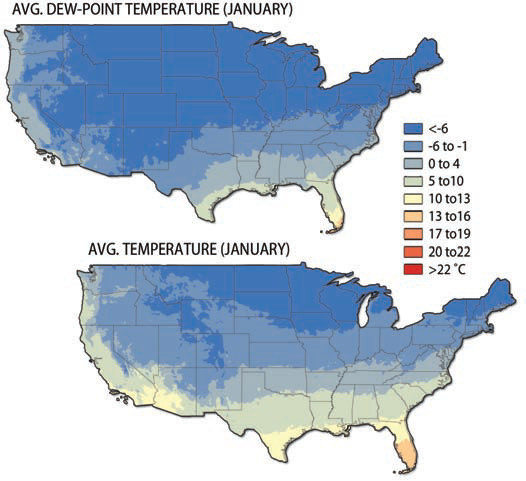
4. January dew-point temperatures are extremely low in northern areas. Little insolation is available to drive the evaporation process under such conditions, so there is limited moisture in the air. When dew-point temperatures are below 0°C, they are called “frost-point” temperatures, and ice forms instead of dew.
5. Dew-point temperatures in eastern North America generally are not far below the air temperature, so air there does not have to cool very much to become saturated. Thus, clouds form even if there are no weather fronts. This is why many eastern states have overcast days in the winter.
6. January temperatures in the Southeast, especially southern Florida, are more moderate, so there is enough energy available to evaporate some water. This results in relatively high dew-point temperatures compared to the rest of the country.
July
7. Summer dew-point temperatures are much higher than in the winter. Increased insolation allows more energy to drive up temperatures and cause more evaporation, which increases humidity.
8. Areas in rain shadows of the moisture sources, such as the Intermontane West, have dew points that remain far below their air temperatures shown on the lower map. A slightly larger amount of moisture flows into southern Arizona from the Gulf of California in the summer, as represented by the small orange spots on the southwestern edge of this map.
9. Summer dew-point temperatures are high in the Southeast, as depicted by the orange colors that fringe the Gulf Coast in the dew-point map for July. This high humidity, combined with high summer air temperatures, creates an oppressive summer climate. Strong clockwise flow around the high-pressure system near Bermuda (the Bermuda-Azores High) pumps moisture from the Gulf of Mexico, Caribbean Sea, and Atlantic Ocean deep into the heart of North America. There are no topographic barriers that would interfere with the movement of this moist air inland, so moisture from the ocean flows onto land, raising dew-point temperatures.
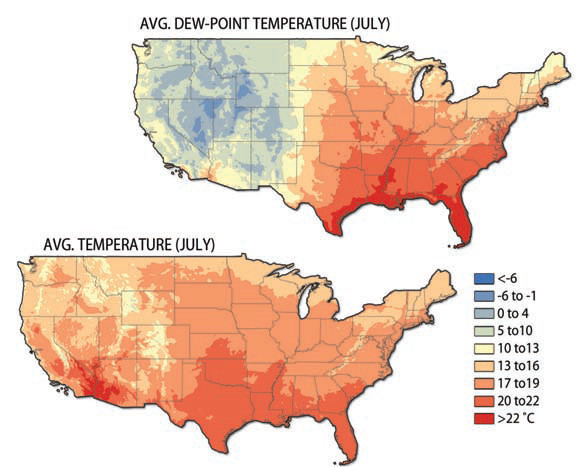
10. Notice the steep gradient in dew-point temperature across the Great Plains, from moderately low dew points in the plains of eastern parts of New Mexico, Colorado, Wyoming, and Montana, to much higher dew points toward the Mississippi River. This gradient mostly shows the northward flow of moisture from the Gulf of Mexico.
11. We can use the combination of these two maps to identify which parts of the country are hot and humid during the summer and those that are cool and less humid — useful in planning a summer vacation!