What Is the Evidence for Climate Change?
OVER THE LAST 150 YEARS, people have measured atmospheric temperatures. This record, albeit short in geological terms, shows an overall increase in temperatures — global warming. There is currently much scientific and political discussion of this topic. What is the evidence that Earth’s climate is changing?
What Is Climate Change?
Earth’s climate has been changing since the planet formed 4.55 billion years ago, varying over timescales of decades to millions of years. Climate change can include global trends in warming, cooling, precipitation, wind directions, and other related measures. Global warming means increasing global atmospheric and oceanic temperatures from some point in the past to the present, compared to an arbitrary mean global temperature (e.g., averaged from 1961 to 1990). Scientists examine various records of Earth’s climate to investigate past changes. In addition to direct measurements, we infer past climatic conditions from other types of observations, called proxy evidence.
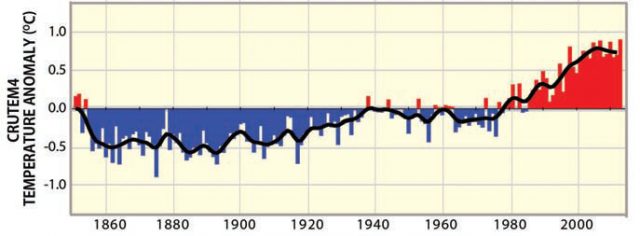
Thermometer Record
Thermometers provide a direct measurement of air temperature. This record shows an average variation in temperature for the last 140 years. According to this record, it appears that average air temperatures have increased over the last century. From the 1940s to the 1970s, the data show a relatively cool period.
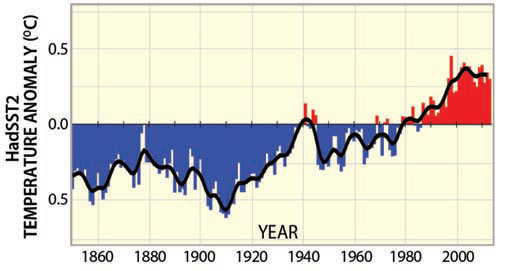
Sea-Surface Temperatures
Another direct measurement of temperature is sea-surface temperature (SST), which is collected from buoys, ships, and more recently by satellites. Observe the SST graph below and then compare it to the air-temperature data to the left.
Glacier Length
Glaciers flow from areas of snow accumulation to lower elevations. The dynamics and energy flow of glacier movement and retreat are well understood. Most scientists interpret changes in the lengths of glaciers to be related to changes in atmospheric temperature and in the amount of precipitation. The combined data from glaciers around the world are interpreted as a warming trend beginning before the turn of the 20th century. Note that changes in glacier length started around 1850, and much melting occurred prior to 1940. Recent warming has been accompanied by another increase in the rate of melting.
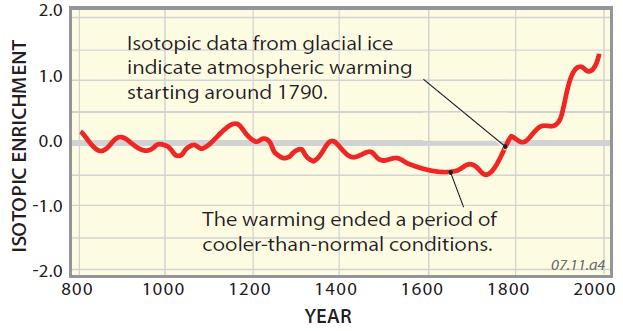
Ice Core Proxy
Continental glaciers on Greenland and Antarctica have yearly layers that record winter precipitation and summer dust accumulations. Scientists extract ice cores by drilling, and then chemically analyzing gases and ice in refrigerated laboratories. Air trapped in tiny bubbles provides samples of the atmosphere (including CO2 concentrations) back to at least 100,000 years ago. Oxygen and hydrogen isotopes in ice provide a proxy for temperature.
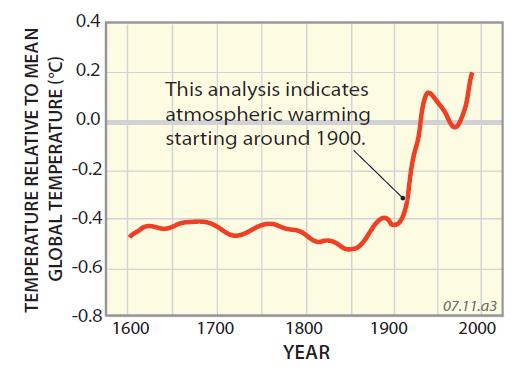
Tree-Ring Proxy
Tree-ring growth is partly dependent on climate. Some trees can grow for 300 years or more, and thickness of tree rings of successive populations from temperature- and precipitation-sensitive forests can be correlated around the world. This provides a climate record going back more than 1,200 years. This figure shows temperatures for the last 1,200 years, as interpreted from tree rings.
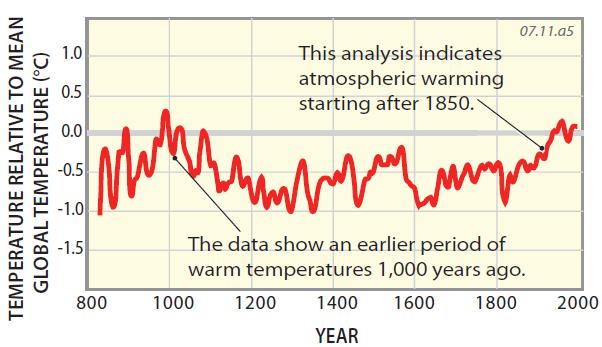
The tree-ring record shows an increase in air temperature between 1850 and 1998. Prior to this, global temperatures were lower, as part of a long cold period called the Little Ice Age. Before that, around 1,000 years ago, was a warm period, which is called the Medieval Warm Period.
Multiple Proxies
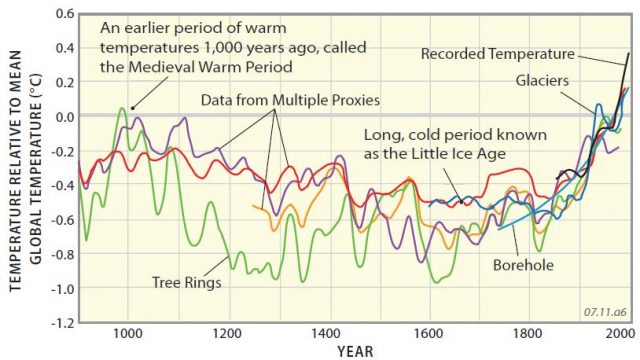
The National Academy of Sciences (NAS) published the curves in the chart to the right as part of a 2006 report to Congress. The report summarizes and compares the various temperature records shown on earlier graphs and some reconstructions produced by combining multiple types of proxies. The plot shows direct measurements, such as the temperature record, as well as the various types of proxy data, each in a different color. The curves have been smoothed to emphasize overall variations and show strong similarities in shape. Comparing the different types of data strengthens the case that global warming has occurred since the mid-1800s. The NAS concluded that Earth’s atmosphere has warmed 0.6 C° in the last 100 years.
Using Satellites to Investigate Temperature Changes
Increasingly, satellites are used to measure and monitor changes in temperature and other expressions of climate with instruments designed to measure different aspects of change. For example, some satellites measure temperature, moisture, or cloud cover in the lower atmosphere, whereas others measure temperature, abundance of different gases, and attributes of higher parts of the atmosphere, like the stratosphere.
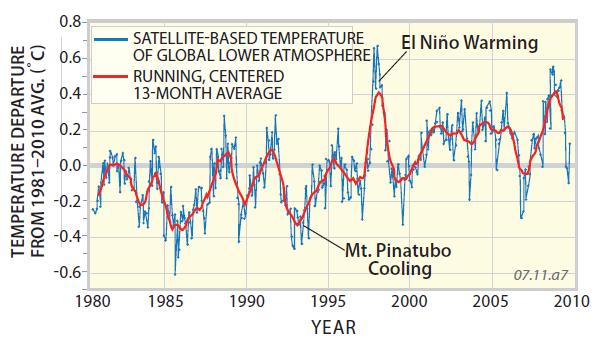
This plot shows monthly averages of satellite measurements of temperatures in the lower atmosphere, along with a red curve fit through the data. The data show an overall warming trend, with shorter periods of cooling and warming, including a peak warm period around 1998, which coincided with a strong El Ni?o event.
Weather, Climate, and the Scientific Method
There is much discussion, and controversy, about one important aspect of climate change — global warming. As shown on these two pages, evidence for global warming since the mid-1800s is clear, but there is active debate about how much of the warming is attributable to human introduction of greenhouse gases (mostly CO2) and how much is due to natural causes. Scientists are always testing, refining, or refuting new, old, or even widely accepted hypotheses — it is part of the scientific method. One misleading and nonscientific tactic used by members of the general public and media, on both sides of the global warming debate, is to point to a specific weather event, like a single hurricane or tornado, a Midwestern blizzard, or a lack of snow in some region, and say that this proves or disproves, or is a direct consequence of, global warming or the lack thereof. Such short-term events are weather, not climate, and have a complex and still incompletely understood relationship to climate change.