Climate zones
Nobody really experiences climate per se. You can experience weather any time just by stepping outside, but climate is the average of sun, rain, snow, wind and other elements playing out over the long haul. This makes it an abstraction, built from the fragments of weather that caress or assault us. Even so, climate is a useful way to think about the sum total of weather and the ways in which it can differ so dramatically from place to place. It wasn't until the late 1800s – by which time Europeans had touched most corners of the world – that scientists could truly begin to assemble the jigsaw pieces of world weather. The first part of the twentieth century became the age of climate zones. Climatologists drew lines to separate one weather regime from another, just as natural scientists had been doing with plants and animals. The difficulty is, climate has few of the obvious break points available to naturalists. It's easy to distinguish a rose from a cantaloupe, but what amount of rainfall ought to separate a semi-arid from an arid region? Added to this, weather doesn't sit still: it flows across artificial climate boundaries with ease.
Because weather is such a fluid quantity, climatologists lean on averages to carry out their work, a process fraught with peril. San Francisco, California, has roughly the same annual precipitation as St Petersburg, Russia, but the two climates are vastly different. When does most of the rain or snow fall? How much of it falls as rain and how much as snow? Does it tend to fall in occasional bursts or in more frequent, gentle rounds? How dry are the driest years, and how wet are the wettest? These are the kinds of questions climatologists address as they try to build a coherent picture from our world of weather.
From pole to tropic
Schoolchildren quickly learn that it's cold at the North and South Poles and hot at the equator. The world's north-south temperature gradient was the first step in climate mapping. Even the ancient philosophers of Greece – who theorized that Earth was round centuries before anyone could prove it – had a sense of this temperature distribution. Working with very little raw data, Parmenides (c. 500 BC) broke Earth's surface into a torrid tropical zone, two temperate zones in the mid-latitudes, and two frigid zones beyond that. The Greek astronomer Hipparchus further subdivided these realms into belts based on the amount of sunlight each latitude gets at the summer solstice. He called these belts klimata – the root of the English word climate.
The ancient Greeks had a decent fix on things, as it turns out. The tropics are indeed a separate climatic realm. Their strict definition is the same as it was to Parmenides: the land between the Tropics of Cancer and Capricorn (23.5°N and S). Because the tilt of Earth's axis is 23.5°, these two latitudes mark the poleward limit of full sun, the points where the Sun is directly overhead at noon on the summer solstice.
A more subtle definition of the tropics involves temperature. You know you're in tropical territory when a typical day's low and high span more degrees than the difference between the average temperature on a summer and on a winter day. Indeed, nighttime is often called “the winter of the tropics”. This view of climate would be unthinkable in a place like Beijing, where the summer-winter difference is in the order of 30°C/54°F, but in the tropics the seasons usually vary by less than 8°C/14°F. Here, rainfall variations are far more dramatic than annual temperature swings, and locals typically refer to wet and dry seasons rather than warm and cold seasons. There's an added twist in Latin America, where the astronomical winter, which is usually quite dry, is referred to as “summer” and the wet astronomical summer is called “winter''. It's a vestige of the region's cultural roots in Spain, where winter happens to be the wettest time of the year.
Many of the world's deserts are clustered in the sub-tropics, close to 30°N and S, where air arrives from other latitudes at high levels and then descends. Closer to the poles, the restless westerlies prevail, and the day-to-day variety of weather is the most vivid. The label “temperate” isn't quite accurate here, since it can be bitterly cold or broilingly hot, so climatologists now favour the label “mid-latitudes” for the zones from about 30° to 60°N and S.
Frigidity is an obvious trait of the polar zones north and south of the Arctic and Antarctic Circles (66.5°N and S). What's less obvious is how little it snows in this frozen realm. The air is so cold at all levels that it carries only scarce amounts of water vapour. In terms of moisture, much of the polar zone could be classified as a desert. The poles' famous round-the-clock summer sunlight is another misleading notion. True, the Sun may be above the horizon for most of the summer, but the solar angle is so low that it feels more like early morning or late evening around the clock. Temperatures seldom stray far above freezing, and the melting ice helps form frequent fogs across much of the Arctic. Winter, on the other hand, is pretty much what one would expect – dark and brutally cold.
More to the picture
Take a closer look at the globe, and you'll easily find exceptions to the north-south temperature rule. Along the 60°N latitude belt, January brings average temperatures that are well below -30°C/-22°F in parts of Siberia and as mild as 5°C/41°F off the coast of Scotland. At latitude 30°N, the average readings in July soar above 35°C/95°F across northern Saudi Arabia, while they stay below 25°C/77°F to the west along the ocean-cooled northwest coast of Africa. Clearly, when it comes to temperature, latitude isn't destiny.
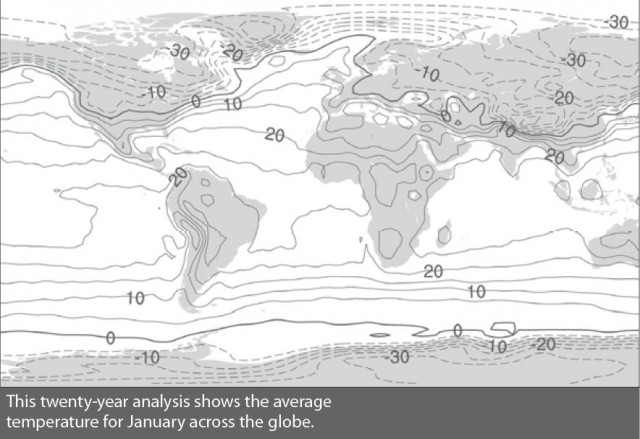
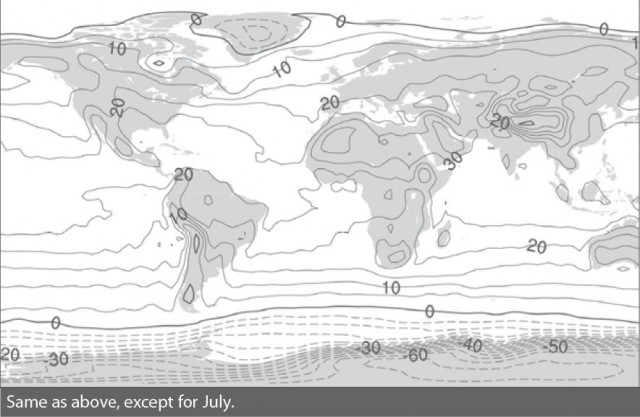
Virtually all of the deviations in the north-to-south temperature regime can be explained by continents – where the/re located and what's on them. Most of the planet's land area (about 70 percent of it) is located in the Northern Hemisphere. Since land heats and cools more readily than water, the north half of the globe is where the biggest temperature swings occur on both a day-to-day and seasonal basis. Notice how North America, Europe and Asia are cooler than the surrounding oceans in winter (January) but warmer than the oceans in the summer (July). This phenomenon is less striking across the Southern Hemisphere because neither Africa, South America nor Australia cover much territory south of 30°S.
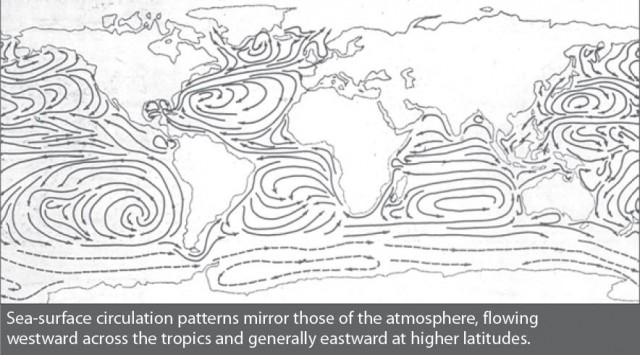
The pattern of ocean currents further sculpts the climate. Driven by prevailing winds, the largest-scale ocean currents are clockwise loops in the Northern Hemisphere and counter-clockwise loops in the Southern Hemisphere. The poleward flow of warm water helps to moderate the climate across western Europe and western Canada, while the return flow of cooler water leads to milder summers than latitude would predict along the coasts of California, Spain and Morocco, Ecuador and Chile, and Namibia.
Mountains are the next-biggest climate player. Their sheer height makes it possible to experience snow near the equator. Mountain ranges that intercept moisture-laden winds produce some of the world's wettest climates, often paired with an arid zone on the other side of the slopes.
Another key climate element is the presence of large inland bodies of water, like the Black Sea or North America's Great Lakes. These help keep temperatures more moderate, and they tend to enhance rainfall or snowfall near their coastlines. Bands of converging wind result from differences in surface wind speed and direction, which are in turn induced by differences in friction over land and water. These bands can produce huge amounts of rain or snow immediately near coastlines. During its ferocious winter of 1976-77, Buffalo, New York, notched 53 consecutive days of snowfall en route to a seasonal total of 507cm/199in.
Climate and the land
Step from a cool forest into a warm meadow on a sunny day, and you've had a brush with the relationship between plants and climate. Everything on the face of the globe absorbs and reflects sunlight based on its colour and composition. In turn, the global patterns of rainfall and sunlight carve out distinct zones of vegetation. If a region gets enough rain or snow year round to compensate for what's lost through evaporation, thick forests can thrive.
Forests cover about a third of Earths land area, including high-latitude areas where precipitation is light but evaporation is low as well. Grasses dominate about one-fifth of Earths surface, where the rains are lighter or more concentrated in the summer months, when evaporation is at its strongest Prairies segue from tall grass to short grass toward the more arid end of this spectrum. Grasses may also take hold where forests have been cut or burned for agriculture, as is the case across vast tracts of tropical rainforestAs much as 20 percent of Earths land surface is occupied by desert, where cacti and shrubs endure by storing water (a year's worth may fall in a single day) and drawing on below-ground aquifers. The rest of the planet is a mix of ice, mountains and ground-hugging tundra vegetation – the only plant life possible in the chilly, damp reaches of northernmost North America and Eurasia.
Plants formed the basis for the first major advance in global climate classification beyond the Greeks. A number of scientists, many in Germany, spent the 1800s relating plants to the characteristics of weather and climate. Wladimir Koppen synthesized and built on this work and, in 1900, began what would become more than a half-century of mapping global climate. Koppen built a base of five climate types – dry, tropical rainy, warm temperate forest, snowy forest and polar – and broke these into sub-groups with a set of temperature-based thresholds. A “snowy forest” climate, for instance, has an average temperature below freezing in its coldest month and above 10°C/50°F in its wannest month. Examples include the northeast US, eastern Canada and most of Russia. Koppen breaks off a sub-zone where fewer than four months in the year average above 10°C/50°F; here, deciduous trees struggle and evergreens dominate.
Although it still commonly appears in textbooks, the Koppen classification scheme isn't the only one. By focusing on plants, temperature and precipitation amounts, Koppen downplayed a key aspect of climate: the balance between precipitation and evaporation. Our planet has an essentially fixed amount of water, so in the long term, what goes up must come down. This doesn't happen equally, however. Much of Australia's rainfall gets sucked up quickly, leaving the continent with few major rivers. Equatorial Brazil, on the other hand, tends to get much more rain than it can evaporate, so a lot of the excess flows to the sea via the Amazon. In the 1930s, US climatologist Charles Thomthwaite – who cut his research teeth in Oklahoma studying the US Dust Bowl – created a system based on the ratio of precipitation to evaporation, regardless of the plants that populate an area.
The art of classifying climate has been eclipsed in recent years by the study of how climate evolves on the geologic scale of millennia as well as on the more tractable periods within our cultural record. Radiometric dating and other tools of the geologist and archeologist have shed much light on how our atmosphere has arrived at its present-day state. These techniques should prove invaluable as the task of assessing tomorrow's climate becomes ever more critical.