What Occurs During Seasonal Circulation Shifts?
GLOBAL ATMOSPHERIC CIRCULATION responds directly to insolation. As the Sun's direct rays migrate seasonally, belts of winds, such as the westerlies, migrate too. In this investigation, you will examine the general circulation of the atmosphere, as expressed by data on air pressure, wind velocity, and cloud cover for two months with very different seasons — January and July.
When examining large-scale patterns of the Earth, such as global circulation patterns, a useful strategy is to focus on one part of the system at a time. Another often-recommended strategy is to begin with relatively simple parts of a system before moving to more complex ones. For this investigation, you will infer global patterns of air circulation by focusing on the Atlantic Ocean and adjacent lands.
This globe is centered on the central Atlantic, and its top is slightly tilted toward you to better show the Northern Hemisphere. As a result of this tilt, Antarctica is barely visible at the bottom of the globe. The colors on land, derived from satellite data, depict rocks and sand in tan and brown. Vegetation is in various shades of green, with the darkest green indicating the thickest vegetation (usually forests). Shallow waters in the Caribbean region (on the left side of the globe) are light blue.
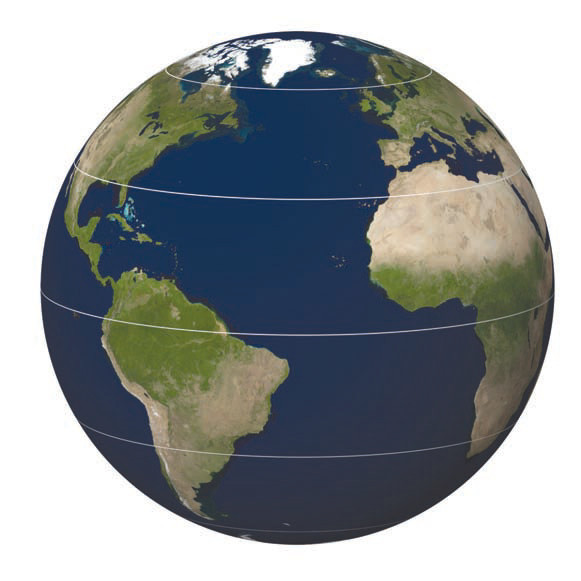
Observe the entire scene, noting which areas on land have the most vegetation and which ones have the least. Compare these vegetation patterns with large-scale patterns of atmospheric circulation and air pressure, like subtropical highs and the Intertropical Convergence Zone ITCZ).
Consider what directions of prevailing winds would occur in different belts of latitude. For example, where in this globe are the two belts of trade winds (one north and one south of the equator)? How about the mid-latitude belts of westerlies in each hemisphere? Consider how these winds might blow moisture-rich air from the ocean onto land. After you have thought about these aspects, read the procedures below and examine the globes and text on the next page, which highlight average air pressure, wind velocity, and cloud cover for two months — January and July.
Procedures
Complete the following steps on a worksheet provided by your instructor or as an online activity.
- Study the two globes showing air pressure (on the next page), and note areas with high and low pressure. Locate the Icelandic Low and Bermuda-Azores High, and determine for which season each is strongest or if there is not much difference between the seasons. Then, locate a belt of low pressure near the equator and the adjacent belts of subtropical highs on either side. Mark and label the approximate locations of these features on the globe on the worksheet.
- Next, examine the two globes that show wind velocity. In the appropriate place on the worksheet, draw a few arrows to represent the main wind patterns for different regions in each month. Label the two belts of westerlies and the two belts of trade winds. If the horse latitudes are visible for any hemisphere and season, label them as well. Mark any somewhat circular patterns of regional winds and indicate what pressure feature is associated with each.
- Examine the two globes that show the average cloud cover for each month. From these patterns, label areas that you interpret to have high rainfall in the tropics due to proximity to the ITCZ or low rainfall due to position in a subtropical high. Examine how the cloud patterns correspond to the amount of vegetation, pressure, and winds.
- Sketch and explain how the different features of circulation and air pressure change between the two months. Answer all the questions on the worksheet or online. OPTIONAL EXERCISE: Your instructor may have you write a short report (accompanied by a sketch) summarizing your conclusions and predicting how seasonal shifts would affect people.
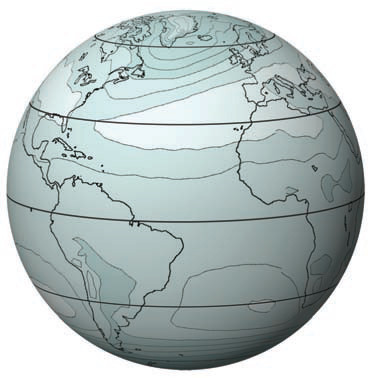
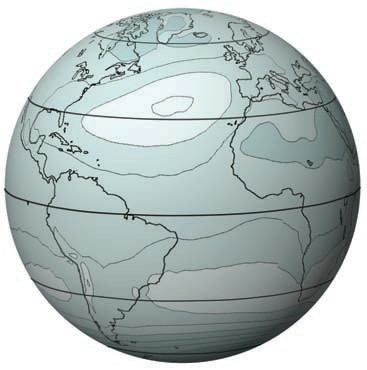
Air Pressure
These two globes show average air pressure over the Atlantic and adjacent land areas during the months of January and July. Lighter gray indicates relatively high pressures, whereas darker gray indicates low pressures. Intermediate grays indicate intermediate pressures. The lines encircling the globe are the equator and 30° and 60° (N and S) latitudes.
Observe the main patterns on these two globes, noting the positions of high pressure and low pressure and how the positions, shapes, and strengths change between the two seasons. Then, complete the steps described in the procedures section.
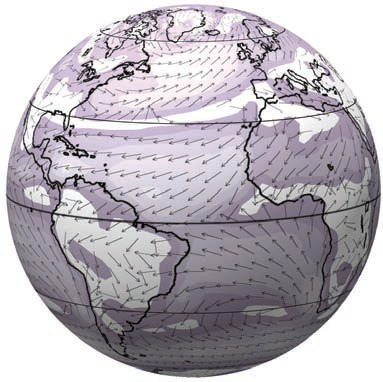
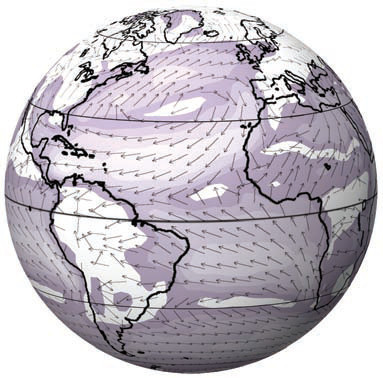
Wind Velocity
These globes show average wind velocities for January and July. The arrows show the directions, while the shading represents the speed, with darker being faster. In this exercise, the directions are more important than the speeds, but both tell part of the story.
Observe the large-scale patterns, identifying those patterns that are related to global circulation (i.e., westerlies) versus those that are related to more regional features, such as the Bermuda-Azores High and the Icelandic Low. Note also the position of where winds converge along the equator and how this position changes between the two months.
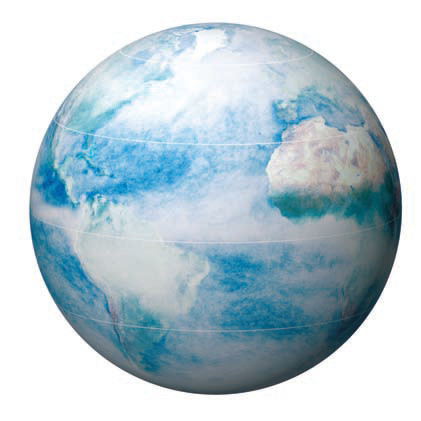
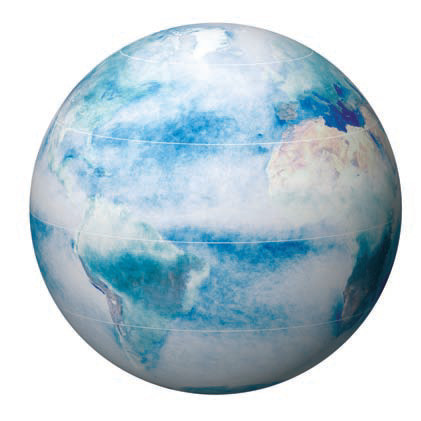
Cloud Cover
The clouds that form, move above Earth's surface, and disappear can be detected and tracked with satellites, shown here for January and July 2012. On these globes, light colors that obscure the land and ocean indicate more abundant clouds (and often precipitation), whereas the land shows through in areas that average fewer clouds.
Observe the large-scale patterns, noting which areas are cloudiest and which ones generally have clear skies. Relate these patterns of clouds to the following: amount of vegetation on the land, air pressure for that month, and average wind directions. Answer all questions on the worksheet or online.