Who Polluted Surface Water and Groundwater in This Place?
SURFACE WATER AND GROUNDWATER in this area are contaminated. You will use the physical geography of the area, along with elevations of the water table and chemical analyses of the contaminated water, to determine where the contamination is, where it came from, and where it is going. From your conclusions, you will decide where to drill new wells for uncontaminated groundwater.
Goals of This Exercise:
- Observe the landscape to interpret the area’s environmental setting.
- Read descriptions of various natural and constructed features.
- Use well data and water chemistry to draw a map showing where contamination is located.
- Use the map and other information to interpret where contamination originated, which facilities might be responsible, and where the contamination is headed.
- Determine a well location that is unlikely to be contaminated.
Procedures
Use the available information to complete the following steps, entering your answers on the worksheet or online.
- This figure shows geologic features, streams, springs, and human-constructed features, including a series of wells (lettered A through P). Observe the distribution of rock units, sediment, rivers, springs, and other features on the landscape. Compare these observations with the cross sections on the sides of the terrain to interpret how the natural environment is expressed in different areas.
- Read the descriptions of key features and consider how this information relates to the geographic setting, to the flow of surface water and groundwater, and to the contamination.
- The data table on the next page shows elevation of the water table in each lettered well. On the worksheet, write the elevation of each well near its location on the map. Since groundwater flows from where the water table is higher to where it is lower, you can determine which way groundwater is flowing simply by assuming it is flowing from higher numbers toward lower ones. On the map, draw arrows pointing in the general direction you think groundwater flows.
- Use the data table showing concentrations of a contaminant, purposely unnamed here, in groundwater to shade in areas where there is contamination. Use darker shades for higher levels of contamination.
- Use the groundwater map to interpret where the contamination most likely originated and which facilities were probably responsible. Mark a large X over these facilities on the map and explain your reasons in the worksheet.
- Determine which of the lettered well sites will most likely remain free of contamination, and draw circles around two such wells.
1. The region contains a series of ridges to the east and a broad, gentle valley to the west. Small towns are scattered across the ridges and valleys. There are also several farms, a dairy, and a number of industrial sites, each of which is labeled with a unique name. Hydrologists studied one of these towns, Springtown, and concluded that it is not the source of any contamination.
2. A main river, called the Black River for its unusual dark, cloudy color, flows westward (right to left) through the center of the valley. The river contains water all year, even when it has not rained in quite a while. Both sides of the valley slope inward, north and south, toward the river.
3. Drilling and gravity surveys show that the valley is underlain by a thick sequence of relatively unconsolidated and weakly cemented sand and gravel. Groundwater is mostly flowing in the sand and gravel, not in the more complicated rocks farther down.
4. Based on shallow drilling, the water table (the top of the blue shading) mimics the topography, being higher beneath the ridges than beneath the valleys. Overall, the water table slopes from east to west (right to left), parallel to the regional slope of the land. All rocks below the water table are saturated with groundwater.
5. From mapping and other studies on the surface, geoscientists have determined the sequence of rock units, as described and listed in the upper right corner of this page. These studies also document broadly curving rock layers beneath the eastern part of the region. Note that contamination can flow through the subsurface, following limestone and other permeable units, instead of passing horizontally through impermeable ones.
6. Bedrock units cross the landscape in a series of northsouth stripes. One of the northsouth valleys contains several large coal mines and a coal-burning, electrical-generating plant. An unsubstantiated rumor says that one of the mines had some sort of chemical spill that was never reported. Activity at the mines and power plant has caused fine coal dust to be blown around by the wind and washed into the smaller rivers that flow along the valley.
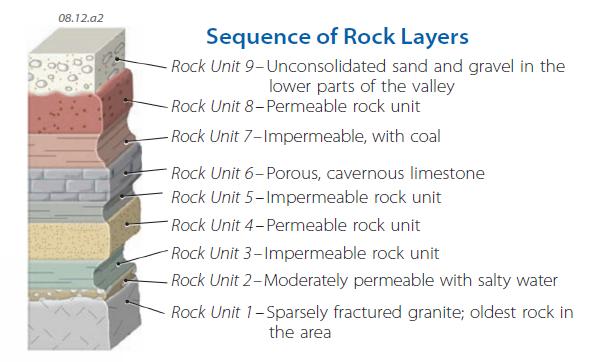
7. A north-south ridge Sequence of Rock Layers is composed of Rock Unit 4. Slidetown, a new town on this ridge, is not a possible source of the contamination because it was built
too recently. A few nice-tasting, freshwater springs issue from Rock Unit 4 where it is cut by small stream valleys.
8. The highest part of the region is a ridge of granite (Rock Unit 1) and sedimentary rocks along the east edge of the area. This ridge receives quite a bit of rain during the summer and snow in the winter. Several clear streams begin in the ridge and flow westward toward the lowlands.
9. A company built a coal-burning power plant over tilted beds of Rock Unit 6, which contains many sinkholes, caves, and karst topography. Rock Unit 6 is so permeable that the power plant has had difficulty keeping water in ponds built to dispose of wastewaters, which are rich in the chemical substances (including the contaminant) that are naturally present in coal.
10. The tables below list water-table elevations (Elev. WT) in meters and concentrations of contamination in milligrams per liter (mg/L) for each of the lettered wells (A–P). This table also lists the concentration of contamination in samples from four springs (S1–S4) and eight river segments (R1–R8). The location of each sample site is marked on the figure. Wells M, N, and P are deep wells, drilled into the aquifer of Rock Unit 6 at depth, although they first encountered water at a shallow depth. The chemical samples from these wells were collected from deep waters.
- What Is Happening with the Ogallala Aquifer?
- How Does Groundwater Contamination Move and How Do We Clean It Up?
- How Can Water Become Contaminated?
- What Problems Are Associated with Groundwater Pumping?
- What Is the Relationship Between Surface Water and Groundwater?
- How and Where Does Groundwater Flow?
- How Do We Use Freshwater Resources?
- How Do Water Balances Vary Spatially?
- How Do We Evaluate Water Balances?