What Causes Hail?
HAIL IS A BALL OF ICE that forms under freezing temperatures within a cumulonimbus cloud and that subsequently falls toward the surface. Large hail that reaches the surface can do so at high enough speeds and with enough force to smash windows, dent cars, and destroy entire fields of crops. How does hail form, what controls the size of individual chunks of hail, and where and when is hail most common?
How Does Hail Form?
Most hail forms in association with a supercell thunderstorm, and much less commonly with other types of thunderstorms. The photograph to the right shows pea-sized pieces of hail, or hailstones, and the figure below illustrates the interesting way in which hail forms. Examine the figure and then begin reading clockwise from the lower left as we follow a single hailstone through the storm. Hail, lightning, and thunder are commonly associated with one another, so the thunderstorms that cause these phenomena are commonly called thunderheads.
1. Supercell thunderstorms and other strong cumulonimbus clouds have strong updrafts, capable of lifting raindrops, chunks of ice, and even planes unfortunate enough to fly into the storm. Such updrafts are associated with the mature stage of a thunderstorm, when air rises against gravity because of a very unstable atmosphere.
2. Once air rises high enough that it enters the subfreezing part of the cumulonimbus cloud (above the red line on this figure), the Bergeron process causes water vapor (shown as a “v” on the diagram) to deposit onto an ice particle, causing it to grow. The resulting hail begins as a small more-or-less-spherical object.
3. As the central part of the storm continues to rise, more vapor deposition occurs and the hailstone becomes larger. The hailstone will continue rising as long as it is not too heavy to be lifted by the updraft.
4. Eventually the hailstone becomes influenced by a nearby downdraft, shown here as the beginning of a downward-arcing flow path.
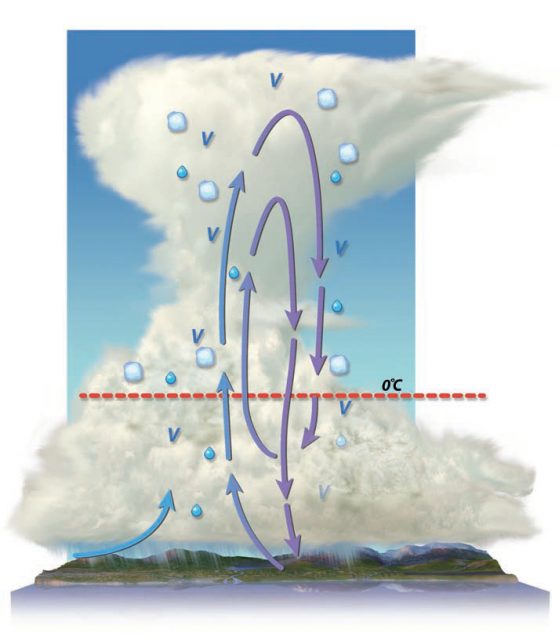
5. If the downdraft causes the hailstone to be carried below the freezing height (the red line), the outer surface of the ice can partially melt. At this stage, a core of ice is coated with a layer of liquid water. While temperatures are above freezing, more liquid water can coat the hailstone.
6. Before the hailstone can fall to the ground, it might get into another updraft. After the updraft lifts the hailstone above the freezing height, the coating of liquid water, most of which was probably melted ice, can refreeze. More deposition of vapor onto ice occurs, accumulating another ring of ice around the hailstone.
7. Once again, the developing hailstone gets caught in a downdraft. After falling to the warmer parts of the cloud (below the red line), more melting occurs.
8. This cycle can repeat many times — freezing and deposition of ice (via the Bergeron process) onto the hailstone above the freezing level, alternating with melting of an outside layer of ice when the hailstone is below the freezing level. Each trip up and down results in another layer of ice added to the hailstone. Eventually the developing hailstone becomes too heavy to be lifted by the updraft, and gravity pulls it to the surface. The more vigorous the updraft and the greater the instability, the larger the hailstone will be before it is finally pulled to the ground by gravity. The larger the hailstone and the faster it hits the ground, the more force it has and the more damage it can cause.
Where and When Does Hail Tend to Occur?
Hail is associated with thunderstorms, so its distribution across the globe and in the U.S. is similar to the distribution of thunderstorms. As in the case of most other forms of severe mid-latitude weather, the U.S. experiences more than its share of hail compared to other locations on Earth. These maps show the geography and seasonality of hail in the contiguous U.S. Observe the general patterns shown on the large map below, and then examine the patterns for a certain month in the series of smaller maps. Try to explain the main patterns before reading the associated text.
This map represents the average number of days per year when a county experiences hail. From the legend, we can see that some areas average less than one day of hail per year, whereas others average more than 10.
Frequencies are low on the Pacific Coast, where contrasts between air masses are typically weak. Frequencies are also low in most of the interior of the West, which is typified by relatively dry air. Frequencies are slightly higher in a north-south band through Arizona, which experiences thunderstorms during a summer monsoon.
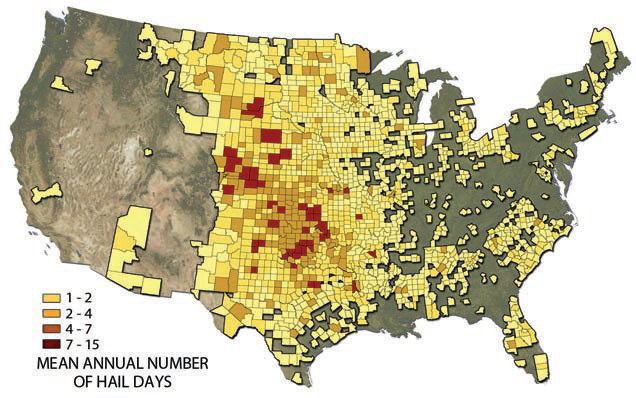
Hail occurs most frequently over the Great Plains, in the center of the map, in a wide, north-south band stretching from central Texas to the Canadian border (and beyond). The average size of hailstones is larger over the Great Plains than anywhere else in the U.S., and perhaps anywhere else in the world. Most damage from hail is from larger hailstones (e.g., >5 cm), and the Great Plains often experiences such hail sizes.
Frequencies in the eastern U.S. are intermediate and spotty in distribution. The size of hailstones generally becomes smaller toward the coast.
Florida and areas along the Gulf Coast have frequent thunderstorms, but low to intermediate frequencies of hail. Here, thunderstorms are seldom tall enough and well-organized enough to form hail. Furthermore, temperature contrasts between air masses is usually not as great as over the Great Plains.
Seasonal Variations
The four maps below show hail frequencies for four different months, each representative of a season (winter, spring, summer, and fall, from left to right). How does hail vary from season to season?
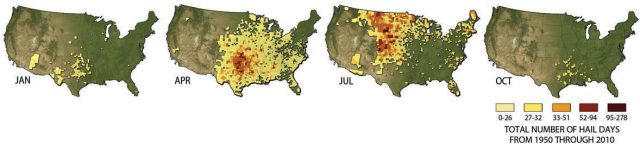
Hail is most frequent in the spring and summer (e.g., April and July). In spring, the surface warms more rapidly than the overlying air, which must be heated by the surface itself. Successively higher locations in the atmosphere require longer to heat. This sets up a steep environmental lapse rate, in which the surface can be quite warm while the atmosphere is cold. This destabilizes the atmosphere, setting the stage for the cumulonimbus clouds that are required for hail to form. In fall, the pattern is reversed as the surface cools more rapidly than the air above it, and the atmosphere is seldom so unstable.
Hail tends to occur later in the calendar year in the northern states than in the southern states. This is no surprise because the boundary between the cold and warm air masses migrates northward as summer approaches. In fall (October) and winter (January), the surface is simply too cold in most of the U.S. to support the atmospheric instability needed for frequent cumulonimbus clouds and intense uplift.
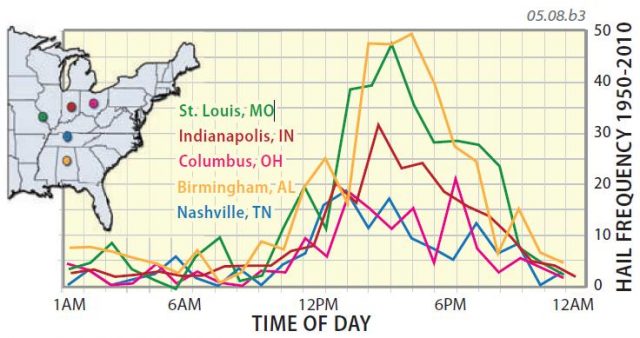
Time-of-Day Variation
This graph plots average frequency of hail versus time of day for five cities. What do you observe? All of these cities show a strong tendency for most hail in the afternoon, when the ground has warmed enough to destabilize the atmosphere. These patterns are very similar to those for severe thunderstorms.