climate classification
CLIMATE IS an average or aggregate of daily weather conditions over a period of years. Latitude, distance from oceans, atmospheric and oceanic circulation pattern, elevation, and local geographical features control the climate of a place. The controls of climate result in a plethora of interrelated elements of climate, ranging from temperature, pressure, wind, humidity, clouds, precipitation, ocean currents, and so on.
Climate classifications are orderly arrangements of data dealing with climatic controls and elements. The purpose of such schemes is to identify climate types and subtypes. Maps and graphs display the climates (for example, wet tropical climates). The classifications typically identify climate regions and subregions that cover broad areas that are subcontinental in size.
The display of climate regions on maps helps us understand the location of other environmental features that climate influences. Such climate-related features include water, vegetation, soils, landforms, and wildlife. They also help us understand the influence of climate on distributions of things important to humans, such as agriculture, tourism, living comfort, and climate-related natural hazards. According to John E. Oliver (1973), there are two approaches to classifying climates—empirical and genetic.
The empirical approach to climate classification uses observed effects of climate (climatic elements). Its primary purpose is to identify the spatial distributions of different climates. The classifications typically use statistics for temperature and precipitation, as weather stations invariably have data on these elements. However, all climatic elements are inherently significant for one purpose or another.
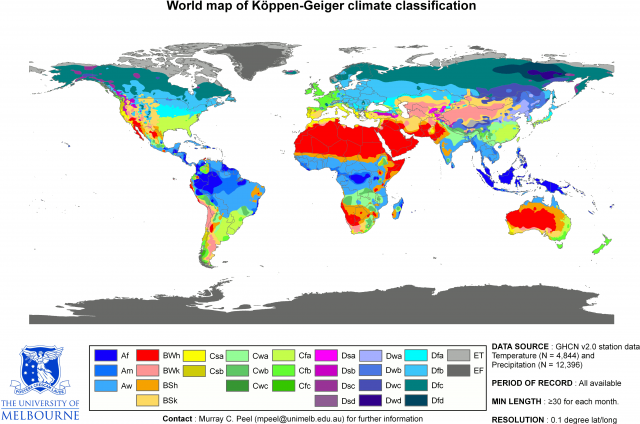
The Koppen classification system is the most famous empirical classification. Originally devised by Vladimir Koppen and published in 1918, the scheme sought to identify vegetation patterns.
Koppen developed statistical parameters using temperature and precipitation data in order to classify climate. He also used vegetation, a natural climatic indicator, as a climate proxy, if temperature and precipitation data were unavailable. A system of letters identifies each climate type; for example, Cfa indicates a humid subtropical climate with a mild winter (C), yearround precipitation (f), and hot summer (a). The Koppen system has undergone various modifications since its inception, but it is arguably the most widely used system for mapping climatic regions on a continental and global scale.
C.W. Thornthwaite devised a rival classification system in 1948. The system focuses on moisture availability and climates. The Thornthwaite scheme is not as highly regarded as the Koppen scheme for its mapping of climates, but it is widely accepted for its practical application to monthly water budget analyses.
Whereas the empirical approach concerns where climates are, the genetic approach seeks to explain why climates are where they are. Thus, genetic classifications use causes rather than effects to delineate climate regions. They focus on dynamic controls of climates (processes that govern exchanges of energy and mass between Earth's surface and the atmosphere). The genetic approach is more theoretical than concrete, as cause and effect is difficult to prove in the complex Earth-atmosphere system.
Geographers developed the genetic approach by focusing on air masses as the main controls of climates. Based in part on the work of Arthur N. Strahler in 1951, John J. Hidore formulated one of the bestknown dynamic climate models in 1969. Using seasonal patterns of radiant energy and precipitation, Hidore refined Strahler's earlier grouping of air mass climates into tropical, temperature, and polar types. The model includes nine climates, three climates in each of the three major groupings. There are also four types of air masses (maritime tropical, continental tropical, maritime polar, and continental polar). The frequency (measured in number of months in the year) and seasonality of air masses in a region determines the region's climate. A world climate map by Strahler and Strahler (2005) has the same tripartite major grouping, but it includes fourteen climates with six possible subtypes.
Climate classification arose from a need to empirically define climates and their boundaries and to explain climate distributions. By the mid-twentieth century, geographers had developed several successful classifications. The schemes used relatively simple statistics, maps, and graphs. In contrast to a growing sophistication in climate science as a whole, climate classification today more often than not relies on these early schemes or revisions of them.