How Do We Classify Climates?
CLASSIFICATION IS THE PROCESS of grouping similar items together and separating dissimilar items. Items that are similar in some ways can be different in others, and items that are in different groups can have certain similarities. Classifications allow us to examine general patterns, with the caveat that interpretations derived from classified groups are best done cautiously. Here, we examine a well-established method of classifying climates.
What Is the Purpose of Classifying Climates?
Climates are classified to let us observe broad patterns and to simplify communication about the characteristics of a region. Historically there have been thousands of meteorological stations collecting information, and in the past few decades this wealth of knowledge has expanded with the addition of large quantities of remotely sensed information. Classification helps us to seek useful generalizations from this enormous amount of information. Climate can be classified in many ways, with the exact nature of the classification depending upon the research question that is of interest.
1. Colors on this map of an imaginary country represent mean annual temperatures (reds above 28°C, blue and purple below 0°C). The black contours represent mean annual precipitation in millimeters, and are called isohyets. Meteorological stations are shown as dots. Examine the patterns on this map and think about how you might classify different parts of the country (e.g., cold and wet).
2. The most southerly areas are hot, which is an important fact if we were investigating an outbreak of a heat-related sickness. But we might classify stations in the southeast differently than those in the southwest because of the differences in precipitation (and therefore in humidity and perhaps in mold).
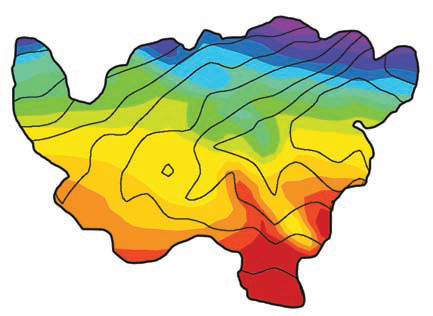
3. A study of the timing and magnitude of floods might focus on (1) regions where winter temperatures reach below freezing, opening up the possibility of flooding due to spring snowmelt, and (2) the amount of winter precipitation, which controls how much snow accumulates.
4. Most crops have fairly well-defined climatological requirements for their growth. A climate classification could be developed based on “optimal,” “fair,” or “poor” for growing that crop. For example, the best conditions for coffee are average temperatures of about 20°C and 1,800–2,800 mm of precipitation. Areas for possible coffee cultivation in this country would be very limited.
What Climate-Classification System Is Most Widely Used and Why Is It Useful?
Vladmir Koppen was a botanist interested in the global distribution of vegetation types. He surmised that the annual temperature and precipitation regimes determined the types of natural vegetation. Other influences on plant growth, such as which way a slope faces, the number of consecutive days without precipitation, and the type of soils, have more localized effects and so were not considered by Koppen.
Koppen first published his climate classification system in 1884. On his maps, the lines separating different types of climate also separate different realms of natural vegetation. For each climate type, Koppen carefully selected thresholds of temperature and precipitation that preserved the boundaries for that characteristic assemblage of vegetation. The original scheme underwent modification as more information on global climates and vegetation became available. The resulting Koppen climate classification is the most widely used system; an example is portrayed on this climate map of South America. Notice how the patterns of colors correlate with latitude, elevation, proximity to the ocean, and other aspects of position within the continent. Some of the boundaries would be recognizable on a satellite image.

In reality, boundaries between climatic types are not static from year to year and not as clearly delineated as the map would suggest. Instead a boundary between vegetation and climate types usually occurs across a broad transition zone, known as an ecotone. In South America, an ecotone occurs between the Amazon rain forest and mountain climates of the Andes.
Koppen’s system was designed to delineate vegetation realms, so it overlays well with worldwide natural vegetation zones — biomes. Both climate and vegetation are major controls on the types of soil that develop, leading to a notable similarity between the Koppen classification and maps of world soils. These linkages between climate, vegetation, and soils ensure that Koppen is still relevant in understanding the physical geography of our continents at planetary and regional scales. Here, because of data availability over oceans, we can compute the climate type over the ocean. But because Koppen was interested in vegetation realms, he never intended for the climate over an ocean surface to be classified.
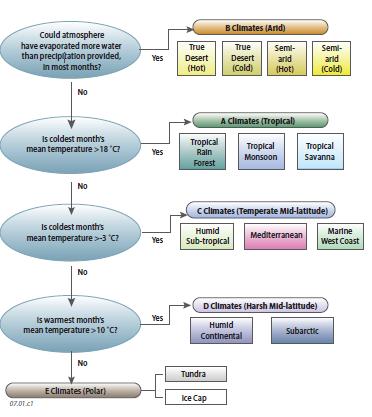
How Is the Koppen Classification System Organized?
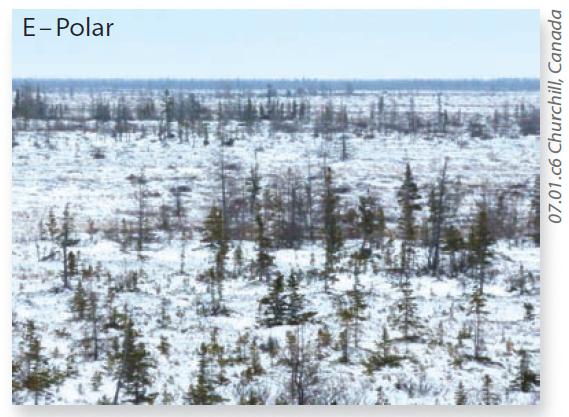
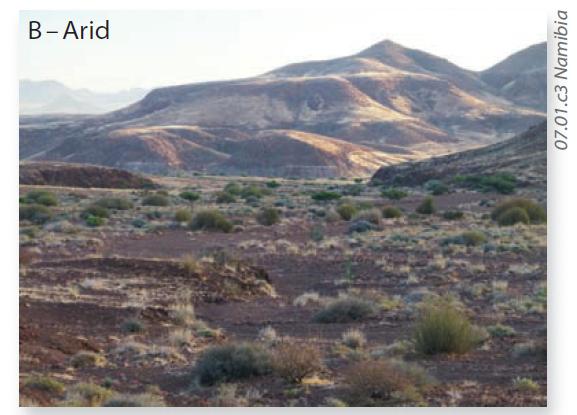
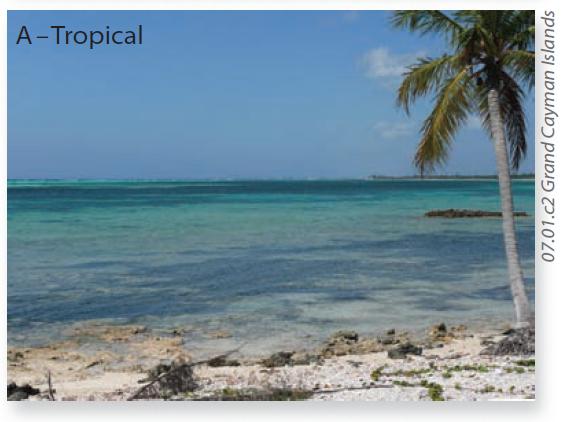
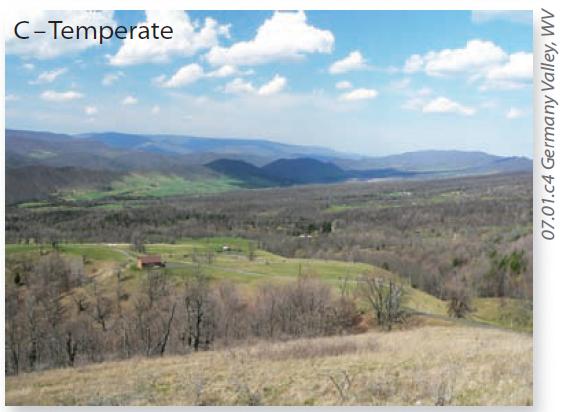
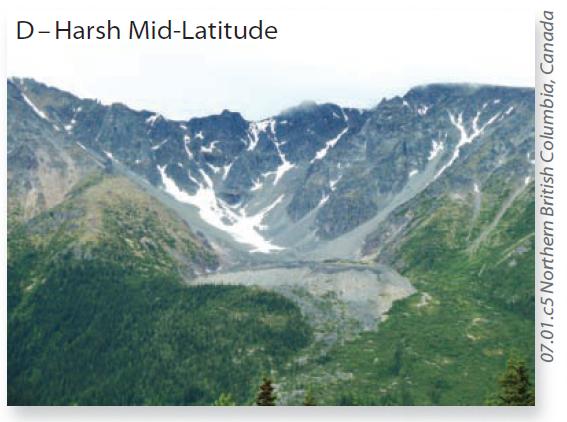
The Koppen climate classification system has five major categories, represented by the first (capital) letter of the labels on the South America map. These are the following: A – tropical climates, B – arid climates, C – temperate mid-latitude climates, D – harsh mid-latitude climates, and E – polar climates, each represented by a photograph below. The five categories are further subdivided by comparing the climate of an area to a succession of criteria of temperature and the availability of water, as illustrated by the flow chart below. In the A, C, and D climate types, the second letter is lowercase and indicates whether the climate is wet year-round (f), has a dry summer (s), has a dry winter (w), or experiences a monsoon (m). The second letter is uppercase for arid and polar climates. Subsequent pages list key characteristics of each type of climate, but follow the flow chart below first.